Accuracy and precision
Accuracy and precision are closely related, but not exactly the same. Accuracy describes how close measurements are to a specific value, while precision describes how close the measurements are to each other. For example, a weighing scale that consistently measures 5 pounds higher than what it should is precise, but not accurate. A person who weighs 150 pounds who uses this scale would consistently get readings around 155 pounds, which is a precise, but inaccurate measurement.
Thus, given a set of data comprised of repeated measurements of the same quantity, the set is accurate if the average value is close to the true value, while the set is precise if all the values are close to each other, regardless of how they relate to the true value. A given set of data can therefore be either accurate or precise, both, or neither. Another way to picture this is to use a set of targets, as shown in the figure below, where each dot represents one of four shots fired at the target.

|

|

|

|
Accuracy
Accuracy is a measure of how close an experimental or observed value is to its true, theoretical, or accepted value. One way to determine the accuracy of measured data is to compute the mean of a sample of the data, then compare it to the mean of the population. The sample mean, x, can be calculated as

where n is the sample size and xi refers to the ith value in the set. Similarly, the population mean, μ, can be calculated as

where N is the population size and xi refers to the ith value in the set.
Percent error
The percent error is a calculation that can be used to determine how much the observed value varies from the true value:

Given that a person weighs 150 pounds (true value) and a scale returns a value of 155 pounds (observed value), the percent error between their true and observed weight is:

The closer the observed value is to the true value, the lower the percent error, and the more accurate the measurement.
Regardless how carefully an experiment is conducted, measurement error can occur. Measurement errors are typically categorized as systematic or random error. In the context of experimentation, systematic errors are errors that are consistent and affect all measured values in the same way if not corrected. They are commonly a result of human error, such as using equipment that is not correctly calibrated. If the equipment calibration is corrected, the systematic error(s) can be eliminated.
On the other hand, random errors are inconsistent and unpredictable, and can occur due to uncertainty that is inherent to the measuring process or the quantity being measured. Unlike systematic error, random error cannot be controlled or rectified.
Precision
Precision is a measure of how close repeated measurements of some value under the same conditions are to one another. An experiment that consistently produces very similar values has high precision. There are a few different ways to determine precision.
Using the range of values
One way to determine precision is to use the range of measurements taken in an experiment. Using this method, the precision is expressed as:
mean ± range
This method is quick, but generally less accurate than other methods.
Example
Express the precision of the following set of data given 5 measured values: 32, 29, 30, 28, 33.
The range of the data is the difference between the largest and smallest values:
33 - 28 = 5
The mean of the data is the sum of the values divided by the total number of values:
(32 + 29 + 30 + 28 + 33)/5 = 30.4
Thus, the precision is:
30.4 ± 5
Using the average deviation
Precision can also be expressed based on the average deviation of the measurements from the mean:
mean ± average deviation
Average deviation can be computed as:

This method generally requires more computation, but it is more accurate than using the method above since it considers the variation between each element in the data set relative to the mean.
Example
Express the precision of the following set of data given 5 measured values: 32, 29, 30, 28, 33.
The average deviation is:
 |
 |
 |
|
 |
Thus, the precision is: 30.4 ± 1.68.
Error
As discussed above, random errors are errors that occur as a result of events that cannot be controlled, and can vary from measurement to measurement. Measurements that have both a high degree of precision and accuracy are said to be reliable and valid.
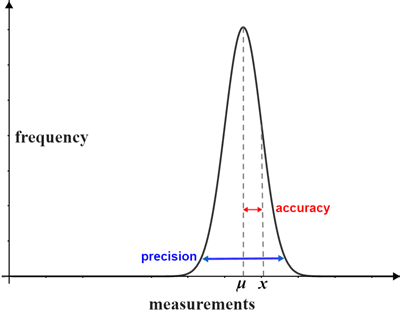
The graph of a frequency distribution for a set of measurements is shown below.
The accuracy is the difference between the mean, μ (the accepted value), and an observed value of x. The precision is the range of the distribution within which the majority of measurements lie, relative to the mean. For normally distributed data, 99.7% of the measurements lie within three standard deviations from the mean.
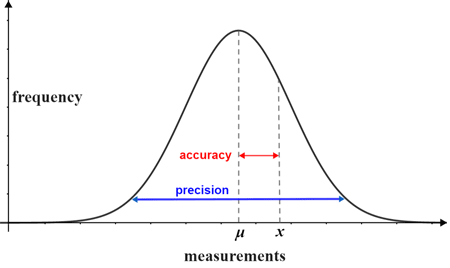
The smaller the standard deviation, the more reliable the measurements. In an ideal experiment, measurements will be relatively close to each other (precise) and lie close to the mean (accurate). Below is a figure of a frequency distribution in which the values are both more accurate and precise (relative to the distribution above).