Linear regression
Linear regression is a method used to fit the relationship between an independent and dependent variable to a linear model. Linear regression in statistics is much more nitpicky, but you will need linear regression sometimes in algebra to find the best-fit line for a set of data. The best-fit line is the linear equation that best models the data.
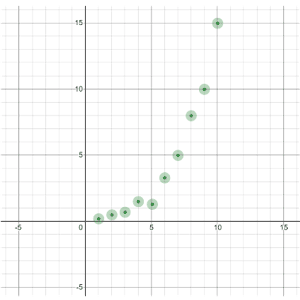
Before you use linear regression on a scatterplot of data, you will need to see if the relationship between the independent and dependent variable is truly linear. If the relationship is nonlinear, the linear model would not be a good model for the data.
Determining whether or not a relationship is linear can be fairly subjective. If the data looks like it could follow a straight line, you can probably use a linear regression as a reasonable model of the data.
Example
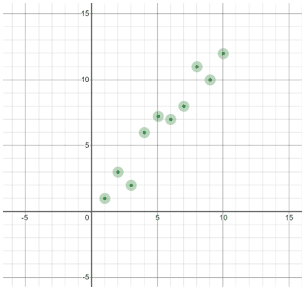
| Fairly straight data | Curved data |
|
|
If the relationship looks fairly straight, then you can use linear regression. Most graphing calculators have a linear regression function that enables you to perform linear regressions on data you enter.
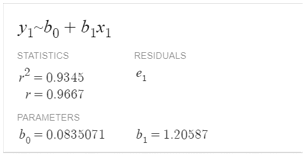
Different graphing calculators have different procedures for using linear regressions, but in general, the calculator should return a linear equation. In statistics, the best-fit line is in the form:

Notice that this is the same as the slope-intercept form y = mx + b, just with different variables. In the equation for the best-fit line, b0 represents the y-intercept of the line, while b1 is the slope.
The calculator may also return the values of some other variables. Those are variables used in statistics. Below is an example of what performing a linear regression may look like in a calculator:k
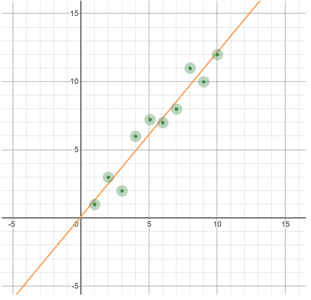
After finding the best-fit line, you can plot both the scatterplot and the best-fit line on one graph to see how they match up: