Parametric
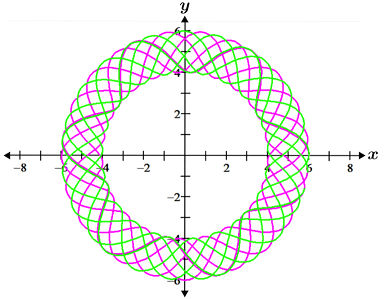
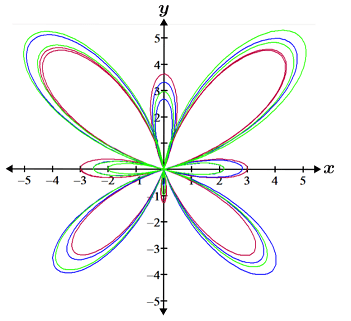
Independent variables that describe a system that is modeled by equations are referred to as parameters. A parametric equation is an equation that is used to define a group of quantities as functions of parameters. The two figures are formed using multiple sets of parametric equations.
|
|
Formal definition
Given two continuous functions, f and g, written in terms of t over some interval,

are a set of parametric equations where t is the parameter. The curve formed by the set of points  is typically denoted as C. Parametric equations are useful for writing equations of curves that are not functions, such as the figures depicted above.
Example
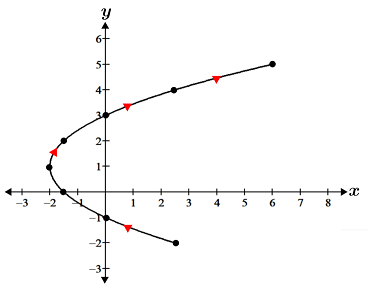
Graph the curve given the set of parametric equations

One way to graph the curve is to create a table of the x and y values and then plot them:
|
|
In the figure above, we can see that the path of t forms a parabolic curve over the given interval. The arrows in red indicate the direction in which the curve is mapped out in the coordinate plane.
In order to graph this same curve in rectangular rather than parametric form, we would need to use the following two equations:

and

The graphs of f and g over their respective domains are shown below:
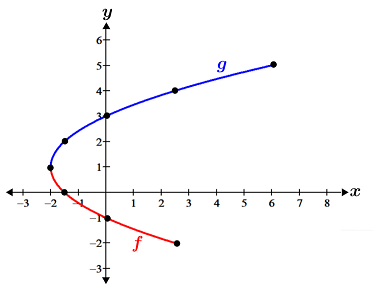
Notice that the two curves look identical. The key difference between how the graph is formed in parametric or rectangular form is the direction in which the graph is mapped. For the graph in rectangular form, the curves formed by f and g are both mapped from left to right, while the graph of the parametric equation starts from the right, moves left, then loops back around to the right.
One example of the application of parametric equations is its use in modeling the motion of an object over time. A ball that is hit with a bat at a certain angle and speed can be modeled with the rectangular equation,
 ,
,
which is graphed as follows:
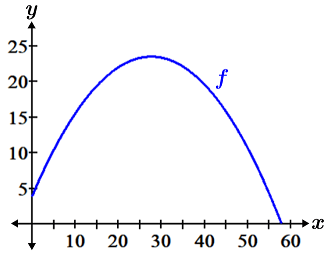
While the graph shows the path as well as the horizontal and vertical position after the ball is hit, it does not show the position of the ball at a given time. In parametric form however, the position of the ball at a given time can also be shown using the following equations:

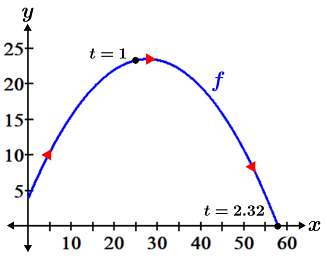
To determine where the ball is at a given point in time, plug the time into these equations. For example, given t in seconds and distance in ft, at 1 second, x(1) = 25 ft and y(1) = 23.36 ft. With these equations, we can also determine information such as how long the ball remains in the air by solving for y = 0, which will yield the time that the ball hits the ground:

Solving for t yields t = -0.11 or 2.32. Since time cannot be negative, the ball remains in the air for 2.32 seconds before hitting the ground. The graph of the parametric equations showing the path of the ball is the same as the graph in rectangular form, and is shown below along with red arrows indicating the mapping of the graph:
Eliminating the parameter
Given a set of parametric equations for x and y in terms of t, we can convert the equations to rectangular form by eliminating the parameter. There are a few ways to do this.
Substitute one parametric equation into the other
First solve one of the parametric equations for t, then substitute this value into the other equation in the set. For example, let x(t) = 2t and y(t) = t2 + 1 be a set of parametric equations. Solving the first equation for t yields t = x/2, and plugging this into y(t) yields:

In some cases, the domain of the rectangular equation needs to be modified for its graph to be exactly the same as it is in parametric form.
Example
Convert  and
and  to rectangular form.
Solving x(t) for t yields:
 |
 |
 |
 |
 |
 |
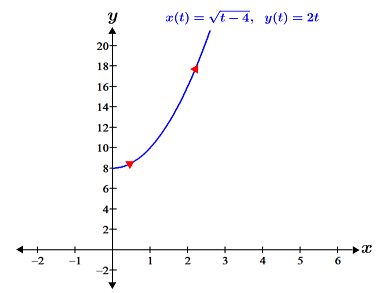
Substituting this into the second equation yields  , which is a graph of a parabola that is defined for all real numbers, x. Looking at the equation for x(t) in the parametric set of equations, the domain is restricted to all real numbers t ≥ 4, which means that x(t) ≥ 0, so the domain for the rectangular equation must be restricted to x ≥ 0 to match. This is depicted in the figure below:
Using identities
We can also eliminate parameters using identities. For example, let x(θ) = 3cos(θ) and y(θ) = 3sin(θ) be a set of parametric equations where 0 ≤ θ < 2π. Solving the equations for cos(θ) and sin(θ) yields:

Substituting these values into the identity  yields
 |
 |
 |
|
 |
 |
which is the equation of a circle with radius 9 centered at the origin. The range of values for x(t) on the interval 0 ≤ θ < 2π is -3 ≤ x(t) ≤ 3, so the domain of the rectangular form of the equation is -3 ≤ x ≤ 3.
Example
Find the rectangular form of the following parametric equation:

Solving each equation for sec(θ) and tan(θ) yields:

Then, substituting these into the identity  yields
 |
 |
 |
 |
 |
|
which is a hyperbola in standard form. The graph of its transverse axis is along the x-axis, and its center is at the origin. The range of values for x(θ) over the interval of 0 ≤ θ < 2π is x(θ) ≤ -4 or x(θ) ≥ 4, so the domain for the rectangular form of the equation of the hyperbola is x ≤ -4 or x ≥ 4.
Equation of a line in 3D
In the three-dimensional (3D) coordinate plane, vectors are used to express the equation of a line. Let line AB contain point B = (x1, y1, z1) and let AB be parallel to vector  . If A = (x, y, z) is any point on line AB, then vector
  , and vector AB is parallel to v. Vector AB can be written as some scalar multiple of v; given that t is the scalar,

Thus, for line AB, x - x1 = tv1, y - y1 = tv2, and z-z1 = tv3, which can be written as the following set of parametric equations:

Example
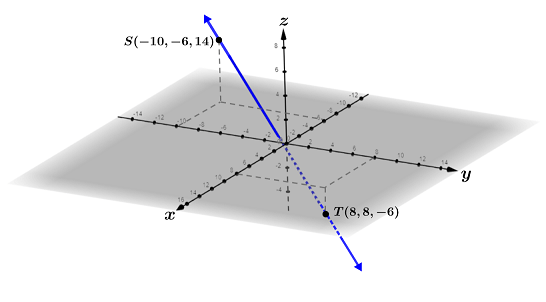
Write the equation of line ST in parametric form given point S = (-10, -6, -14) and point T = (8, 8, -6).
First, find vector v:

Using point S, line ST is:

Note that when t = 0 and 1, we get our two given points:


The graph of line ST is shown in the figure below: