Residual
A residual is the difference between the observed value of a quantity and its predicted value, which helps determine how close a model is relative to the real world quantity being studied. In statistics, models are often constructed based on experimental data in order to analyze and make predictions about the data. The smaller the residual, the more accurate the model, while a large residual may indicate that the model is not appropriate (e.g. a linear model for a quadratic data set). The figure below shows an example of residuals for a simple linear regression:
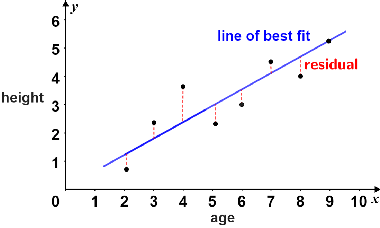
The line of best fit, shown in blue, is a model of the heights of a sample of boys of different ages. The residuals are represented by the dotted red lines between each value and the line of best fit. Points that lie above the line of best fit have positive residuals; points that lie below have negative residuals; points that lie on the line have residuals of 0. Note that the sum of all the residuals should, by definition, be 0. In practice, the sum of residuals may not be exactly 0 due to rounding.
How to calculate residuals
To calculate residuals, find the difference between the observed value and the predicted value. The equation for a simple linear regression model is represented as,

where x is the independent variable,  is the dependent variable,
  is the y-intercept, and
  is the slope of the line.
Residuals formula
Given that n values are collected for an experiment, the residual, e, is

Below is an example of how to calculate residuals.
Example
Let  be the line of best fit for the following data:
| x | y |
|---|---|
| 5 | 3 |
| 8 | 5 |
| 11 | 8 |
| 12 | 12 |
| 16 | 14 |
Find the residuals using the equation:
 .
.
can be found by plugging each x value into  :
:

Once is computed for each x value, the residual is computed by subtracting the y value from . The results are shown in the following table.
 |
 |
|---|---|
| 2.609 | -0.391 |
| 5.825 | 0.825 |
| 9.041 | 1.041 |
| 10.113 | -1.870 |
| 14.401 | 0.401 |
The regression line for the data is shown in the figure below.
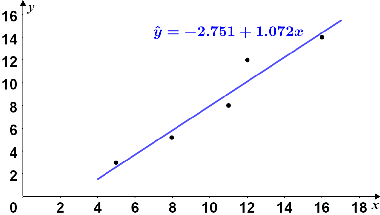
The residuals are relatively small in magnitude, so the observed values are relatively close to the regression line, as shown in the figure. Thus, the model appears to be a good fit for the data. At the very least, the data seems to have a linear relationship.
Residual plot
A residual plot is a type of scatter plot that is used to determine whether a model is a good fit for the data. The horizontal axis of a residual plot represents the independent variable while the vertical axis represents the residual values.
The table below contains a set of data points and their respective residuals given by the regression line  .
.
| x | y | |
|
|---|---|---|---|
| 2 | 4 | 5.466 | 1.466 |
| 5 | 9 | 8.613 | -0.387 |
| 7 | 12 | 10.711 | -1.289 |
| 12 | 15 | 15.956 | 0.956 |
| 13 | 19 | 17.005 | -1.995 |
| 18 | 21 | 22.250 | 1.250 |
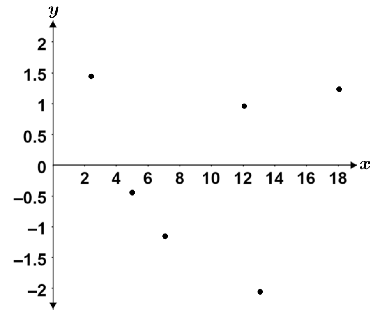
The resulting residual plot is shown in the figure below:
Characteristics of good residual plots
A good residual plot is one in which the residuals are independent and normally distributed. In other words, the points should be evenly and randomly scattered above and below the horizontal axis of the plot. In general, the following characteristics indicate that the model is a good representation of the data:
- The residuals are close to 0. If the residuals are all 0, the model is a perfect prediction of the data, though this is unrealistic. The farther the residuals are from 0, the less accurate the model. A positive residual indicates that the predicted value is too high while a negative residual means that the predicted value is too low.
- The residuals do not exhibit some kind of pattern (e.g. all increasing or decreasing, forming a parabola, forming a sinusoid, etc). If the residuals exhibit a pattern, the data may be more accurately represented by a non-linear model. Residuals exhibiting a pattern implies that some property of the data is not explained by the model, so other models should be considered.
- There are no unexplained outliers or extreme values. If outliers exist, this could indicate a flawed model or data.
In the residual plot above, the points are evenly distributed above and below the x-axis with no real discernible trends. They are also close to the x-axis relative to the magnitudes of the dependent variable, so a linear model seems to be good fit for the data.
Residuals are useful for determining the quality of a model and whether or not a data set exhibits a linear trend. If the residuals do not have the characteristics described above, we should consider a different model, since the linear model does not adequately represent the data. If the residuals do exhibit the above characteristics, this indicates that a linear model is a good fit.