Regression line
A regression line is a line that models a linear relationship between two sets of variables. It is also referred to as a line of best fit since it represents the line with the smallest overall distance from each point in the data. Regression lines are a type of model used in regression analysis.
The red line in the figure below is a regression line that shows the relationship between an independent and dependent variable.
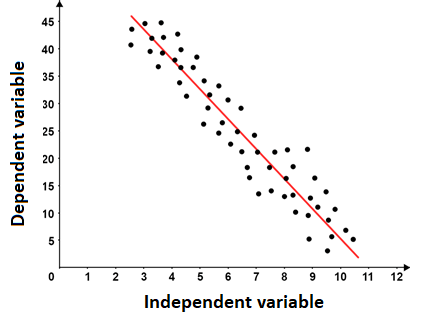
Based on the scatter plot, there seems to be a linear trend between the independent and dependent variable. The regression line models this trend.
Regression lines are typically used to make predictions about a dependent variable based on an independent variable. They can also be used to analyze whether there is a causal relationship between the independent and dependent variables.
Least squares regression
A simple linear relationship with 1 independent variable can be modeled by the equation

where  is the dependent variable,
  is the y-intercept, and
  is the slope of the regression line.
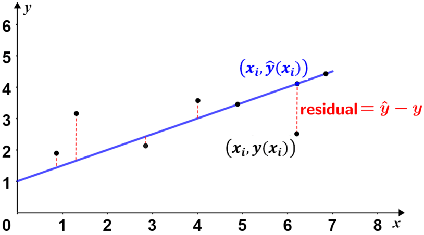
Notice that the equation is similar to y = mx + b, the slope-intercept form of a line. Data points in an experiment are rarely, if ever, perfectly linear. If they were perfectly linear we could simply use the slope-intercept form of a line to write the equation for the regression line. In such a case, each of the residuals would be 0. A residual is the difference between the observed value (data point) and the theoretical value. The dotted red lines between the data points and the regression line in the figure below represent the residuals.
Least squares regression is a method that minimizes the squared residuals of each data point in order to construct a line (the regression line) that is as close as possible to as many of the data points as possible. Referencing the equation above, and can be computed using the following equations:


Example
Use least squares regression to determine the equation for the regression line given the following set of points:
(1, 3), (4, 7), (5, 8), (10, 15), (12, 13)
Below is a table of the data. Organizing the data in this manner can make it simpler to compute the values of and .
| x | y | xy | x2 | y2 |
|---|---|---|---|---|
| 1 | 3 | 3 | 1 | 9 |
| 4 | 7 | 28 | 16 | 49 |
| 5 | 8 | 40 | 25 | 64 |
| 10 | 15 | 150 | 100 | 225 |
| 12 | 13 | 156 | 144 | 169 |
 |
 |
 |
 |
 |
Using the equations above,
|
 |
 |
|
 |
|
|
 |
 |
|
 |
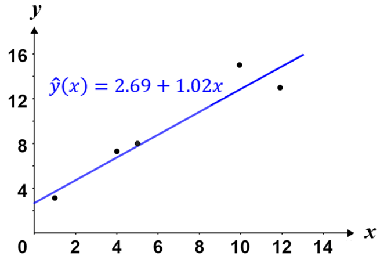
Thus, the equation of the regression line is:

Below is a figure depicting the regression line for the data above.