Regression
Regression analysis is a process used to study sets of data in order to determine whether any relationship(s) exist. It can be thought of as a best guess at the trend that the data follows, and can be useful for making predictions about the data.
Linear regression is the most common form of regression analysis. However, there are many different forms of regression, such as logarithmic regression, sinusoidal regression, polynomial regression, and more. At its most basic level, regression analysis is broken down into linear or non-linear regression:
| Linear regression | Non-linear regression |
|---|---|
|
|
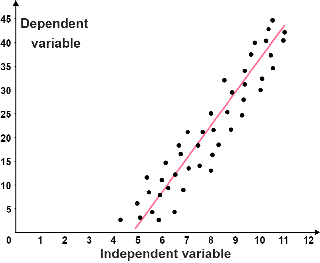
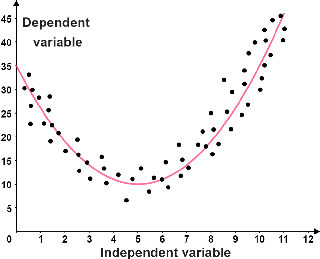
| The data follows a linear trend. The red line is referred to as the line of best fit; it best represents the relationship between the points. | The data follows a non-linear trend. The line of best fit is a parabola, so the data is quadratic. |
Simple and multiple linear regression
A linear regression model attempts to show a linear relationship between an independent variable and a dependent variable; it predicts the value of the dependent variable as a function of the independent variable. There are two types of linear regression: simple linear regression and multiple linear regression.
Simple linear regression
A simple linear regression model has only one independent variable and one dependent variable, as opposed to having multiple independent variables. For example, a simple linear regression could be used to predict the distance that a car can travel based on the size of its gas tank. In this case, the dependent variable is the distance, and the independent variable is the size of the gas tank.
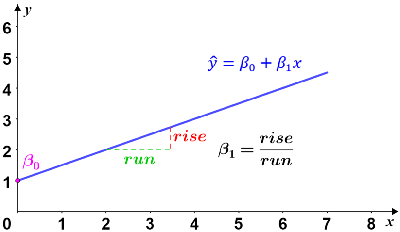
Simple linear regressions can be modeled using the following equation

where x is the independent variable,  is the dependent variable, β0 is the initial value of the dependent variable, and β1 is the change in the dependent variable for every unit change in the independent variable.
Graphically, the model is a line with y-intercept at β0 and a slope of β1. The dependent variable, , also referred to as the expected value, is the expected outcome of the experiment for a given value of x.
Simple linear regressions commonly use the ordinary least squares method to estimate the line of best fit. No matter how accurate, there will always be some degree of variability in any regression model. For a simple linear regression, the accuracy of each value is measured by its squared residual, where a residual is the difference between the observed value (from the data) and the predicted value (based on a model of the data, e.g. a regression line). Given a line of best fit, the residual is the vertical difference between the data and the line of best fit. This is depicted in the figure below.
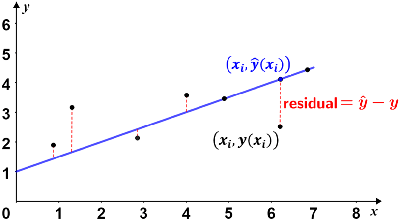
If the data point lies above the line of best fit, the residual is positive; if it lies below the line, the residual is negative; data points that lie on the regression line have residuals of 0. Two such points are shown in the figure.
Multiple linear regression
Multiple linear regression differs from simple linear regression in that it considers multiple independent variables. For example, the simple linear regression example above only used a single independent variable (the size of the gas tank) and studied its relationship to the distance the car could travel. There are other factors that can determine how far a car can travel, other than its gas tank alone. To consider other factors, such as the size of the engine, whether the car is a hybrid, whether it has four-wheel drive, and more, multiple linear regression can be used.
Multiple linear regression can be modeled using the following equation

where xi represents the various independent variables such that i = 1, 2, 3, ... n, is the dependent variable, β0 is the initial value of the dependent variable, and βi is the change in the dependent variable for every unit change in the ith independent variable.