Probability and Statistics
Probability and statistics are two branches of mathematics concerning the collection, analysis, interpretation, and display of data in the context of random events. They are often studied together due to their interrelationship.
Basic probability terms
In order to discuss probability, it is important to be familiar with the terminology used. Below are some of the terms commonly used in probability.
- Experiment - a procedure that results in well-defined outcomes. A random experiment is one in which it is not possible to determine which exact outcome will occur.
- Outcome - any possible result contained in a sample space, S.
- Sample space - all possible outcomes of an experiment form a sample space. The sample space for the flip of a fair coin is S = {heads, tails}.
- Event - an event is any subset of a sample space. Given an event, A, when an outcome that belongs to the subset A occurs, an event has occurred. For example, given that event A is the event that a fair six-sided die lands on an even number, the outcomes 2, 4, and 6 all satisfy event A. If any of those values are rolled, event A has occurred. If 1, 3, or 5, are rolled, event A does not occur.
- Trial - Each flip of a coin, roll of a die, or iteration of an experiment is referred to as a trial. In the experiment of flipping a coin to determine the number of heads, each flip of the coin is a trial in the experiment.
Probability
The outcome of a random event, such as the flip of a coin, cannot be determined with certainty before the event has occurred. However, if the possible outcomes are known (in this case heads or tails) probability theory allows us to predict the chance of a given outcome occurring. In its most common usage, the probability of something occurring is the proportion or fraction of times that a particular outcome is likely to occur.
Probability is represented by a numerical value between 0 and 1 which describes how likely an event is to happen. A probability of 0 indicates that it is impossible for an event to happen while a probability of 1 means that it is sure to happen. Probability is also often expressed using percentages. For example, a 0.5 chance of heads or tails indicates that there is a 50% chance of either outcome occurring.
There are a number of ways to determine the probability of an event. One way is to speculate the probability of the event. For example, assuming that a coin is fair, we can speculate that there is a 0.5 (½ or 50%) chance that heads or tails occurs on a given flip of the coin. However, if we were to flip the coin many times and observe and collect a large amount of data, and we find that the coin lands on heads 75% of the time, we may make the conclusion that the coin is not fair; the coin seems skewed towards tails, assuming that our data collection and the observed probability are well substantiated.
Below is an example of the calculation of the probability of a simple event.
Example
What is the probability of rolling a 5 with a fair 6-sided die?
For a perfectly balanced 6-sided die, the possibility of each side showing up is the same. Therefore, the probability of rolling a 5 can be calculated as the number of ways the desired outcome can occur (1) out of the total number of possible outcomes (6) or:

There is approximately a 16.67% chance of rolling a 5.
Types of events
The above example is the simplest form of probability calculation. There are many other types of events in probability and it is important to understand each type since the calculation of their respective probabilities differs.
Simple event
A simple event is an event that has only one outcome. For example, when flipping a coin, the outcome of the coin landing on heads is an example of a simple event; the coin landing on tails is an example of another simple event. The probability of a simple event is calculated as:

Compound event
A compound event is an event that includes two or more simple events. Flipping a coin twice and having it land on heads twice is an example of a compound event. The probability of the coin landing on heads on the first flip is 50%, and the probability of it landing on heads on the second flip is also 50%. The probability of a coin landing on heads twice in a row is a compound probability that is computed as the product of the probabilities of the independent events, or:
0.5 × 0.5 = 0.25
Refer to the compound events page for more information on how to compute compound probabilities for different types of events.
Independent events
Independent events are events in which the outcome of one event is unaffected by the outcome of another event. Flipping a coin is an example of an independent event because on each flip of a fair coin, the probability of acquiring a heads or tails is equal. Regardless of the outcome on a previous flip of a coin, a subsequent flip still has a 50% chance of tails occurring and a 50% chance of heads occurring.
Dependent events
Dependent events are events in which the outcome of an event is affected by the outcome of some other event. For example, given that a bag contains 3 blue marbles and 2 red marbles, if one of the marbles is removed from the bag, there is a 60% chance that the marble is blue and a 40% chance that the marble is red. If a blue marble is removed from the bag and is not replaced, the probability of selecting a blue marble on a subsequent trial is no longer 60%. Since there are now 2 blue marbles and 2 red marbles in the bag, the probability of selecting either is 50%. Since the probability in the subsequent trial is affected by an outcome in the first, this is an example of a dependent event.
Mutually exclusive events
Mutually exclusive events are events that cannot occur at the same time. The outcome of heads or tails when flipping a coin are examples of mutually exclusive events. In a single flip of a coin, the coin can only land on heads or tails. If it lands on heads, it means that the coin did not land on tails (and vice versa), since both cannot occur at the same time.
Complementary events
The complement of an event, A, denoted AC, is comprised of all outcomes that are not contained in event A. For example, a fair six-sided die has the possible outcomes 1, 2, 3, 4, 5, and 6. Given that event A is the probability of rolling an even number, or A = {2, 4, 6}, its complement is AC = {1, 3, 5}. The probabilities of A and AC must therefore sum to 1. In other words:
P(A) + P(AC) = 1
P(AC) = 1 - P(A)
Basic probability rules
Probabilities are calculated differently based on a number of factors, including the types of events involved. Below are three commonly used rules.
Addition rule
If A and B are not mutually exclusive events, the probability of A or B occurring is:
P(A ∪ B) = P(A) + P(B) - P(A ∩ B)
where P(A ∩ B) is the probability of A and B occurring.
If A and B are mutually exclusive events, then
P(A ∪ B) = P(A) + P(B),
since P(A ∩ B) = 0.
Refer to the set theory page for more information on the notation used.
Multiplication rule
The multiplication rule is used to find the probability of two events occurring at the same time. If A and B are dependent events, the probability of A and B occurring at the same time is:
P(A ∩ B) = P(A)P(B|A)
where P(B|A) is the conditional probability of event B occurring given that event A has already occurred.
Example
Two cards are drawn from a standard deck of 52 cards. Let A be the event that a king is chosen. B is the event that another king is chosen given that the first card chosen is not replaced into the deck. Calculate the probability of A and B both occurring.
Since there are 4 kings in a standard deck of 52 cards,
P(A) = 4/52
Since one king must be removed in the first draw in order to draw 2 kings in a row, the number of kings and total cards in the deck is reduced by 1. Thus:
P(B|A) = 3/51
The probability of selecting 2 kings in a row is the product of these probabilities:
P(A ∩ B) = P(A)P(B|A) = 4/52 × 3/51 ≈ 0.005
Thus, the probability of selecting 2 kings in a row is approximately 0.5%.
Bayes' rule
Bayes rule (or Bayes' theorem) is a type of conditional probability that can be derived from the multiplication rule. The probability of event A occurring given that event B has already occurred can be determined as:

Bayes' rule is useful because it does not require the joint probability of A and B to be known.
Statistics
Statistics is a discipline that involves collecting, organizing, displaying, analyzing, interpreting, and presenting data. It is widely used in scientific research, when considering social problems, and for industrial purposes, among many other applications.
On a base level, it involves proper data collection through sampling when population data is not known or cannot be determined, designing and conducting experimental and observational studies, and formulating conclusions or re-designing the studies based on the data. Two distinct branches of statistics are descriptive statistics and inferential statistics.
Descriptive statistics
Descriptive statistics is the branch of statistics concerned with summarizing data, be it in graphical, tabular, or some other form. A descriptive statistic is a summary statistic used to describe data. Examples of descriptive statistics include the mean, median, and mode; these are classified as measures of central tendency and are one of the key types of descriptive statistics that provide information about a central or typical value in a probability distribution. Measures of variability are another classification of descriptive statistic; they describe the spread of the data (how stretched or squeezed the distribution is) and include statistics such as the standard deviation, variance, and more.
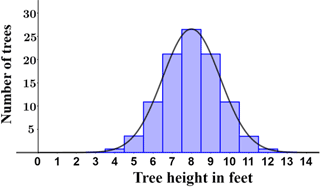
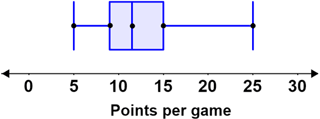
The figure below shows two types of figures used to depict descriptive statistics.
| Histogram | Box-and-whisker plot |
|
|
In particular, the histogram and the curve fitted to it indicate a normal distribution, which is a commonly encountered probability distribution throughout statistics. Many natural phenomena exhibit a normal distribution, giving way to inferential statistics, which allows us to make inferences about data based on their probability distributions as well as other factors.
Inferential statistics
In the real world, it is often not possible, or highly impractical to collect large amounts of data from populations of interest. Ideally, we would be able to acquire all the data we need for a population and make informed decisions based on the descriptive statistics they provide. Realistically, since this is rarely feasible, we instead make inferences about populations as a whole based on samples of said populations and the use of statistical methods; this is the goal of inferential statistics.
For example, we may want to know the mean score on the AP Physics exam for all high school students in the United States. Because of the large scale, it would be both difficult and expensive to obtain the results of every single student in the US. In such a case, inferential statistics can be used to estimate the mean score by collecting samples from the population of high school students, then using the sample data to make inferences or predictions about the mean score of the population as a whole.
When studying random phenomena, we may want to assess whether any observed differences can be attributed to some given input, or if the observed differences can be attributed fully to random chance. This is another area in which inferential statistics can be used through the process of statistical hypothesis testing. There are many different types of statistical hypothesis tests that can be used depending on the conditions of the experiment. In general, the process involves a statement of no difference, referred to as the null hypothesis, and a comparison of what is observed to what we would expect based on this null hypothesis. Through use of statistical methods, we can then draw conclusions about the significance of observed data.