Venn diagram
A Venn diagram is a visual way to show relationships among sets. It is usually made with circles.
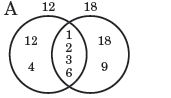
Venn Diagram A shows the set of factors of 12 and 18. The factors that are the same for both numbers are included in the overlapping region. These members, or elements, are the same for the two sets.
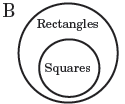
Venn diagram B shows that all squares are rectangles. It also shows that there are rectangles that are not squares.
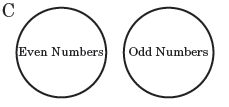
disjoint sets
Venn diagram C shows that the sets of odd numbers and even numbers do not share any elements (a number cannot be both odd and even). Since the sets of odd numbers and even numbers do not share any elements, they are called disjoint sets.
Did you know?
Venn diagrams are named for John Venn, an Englishman who lived from 1834 to 1923. Venn studied logic and developed diagrams as tools for logical thinking.