Contour
Contour plots are used to depict functions that have a two-dimensional input with a one-dimensional output. Consider the following figure.
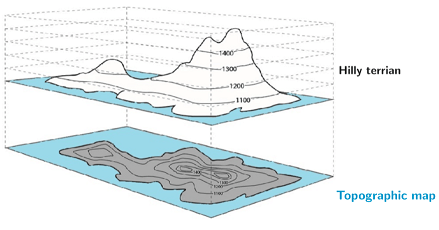
The figure depicts a representation of some hilly physical terrain along with its topographic map. A topographic map is a two-dimensional (2D) representation of the three-dimensional features of the Earth's surface, such as hills. The curves of a topographic map, referred to as contours or contour lines, are used to depict the varying elevation of the terrain. Each curve in the figure above represents an increase in elevation of 100 ft.
Formal definition
Let z = f(x,y) be a function of two variables that forms a curved surface in the 3D coordinate plane. If a plane z = k, where k is some constant, intersects the surface, a contour with the equation k = f(x, y) is formed. These curves are also referred to as level curves since their distance from the xy-plane is k for any point on the plane.
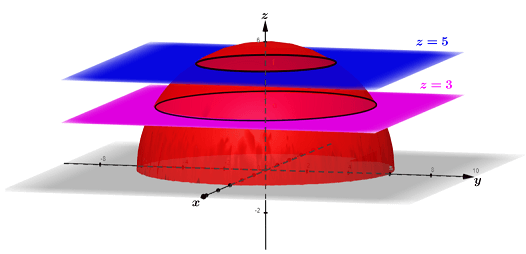
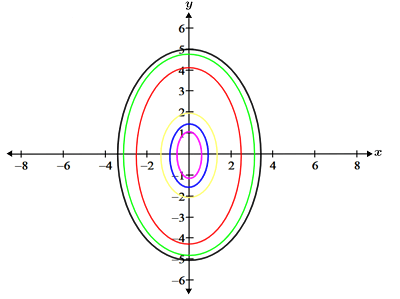
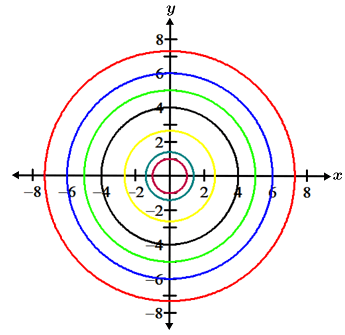
The graph of the hemisphere,  is intersected by planes z = 3 and z = 5. The intersections of the planes with the hemisphere form two contours, both of which are circles with centers about the z-axis; the circle formed by plane z = 3 has radius of 3√3 and the circle formed by z = 5 has radius of √11. Also, note that these contours are level curves that are parallel to the xy-plane. Translating these level curves onto the xy-axis creates a contour map of the hemisphere. Below is a contour map of the above hemisphere, using planes z = 3, z = 5, and others (there are infinitely many contours for the hemisphere).
The table below shows a few other examples of contour maps for common 3D surfaces:
| Ellipsoid | Contour map |
|---|---|

|
|
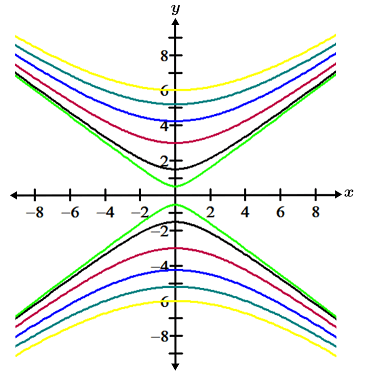
| Hyperbolic paraboloid | Contour map |
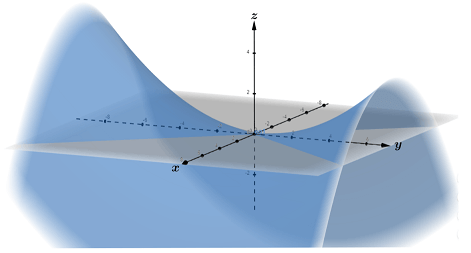
|
|
| Hyperboloid of one sheet | Contour map |
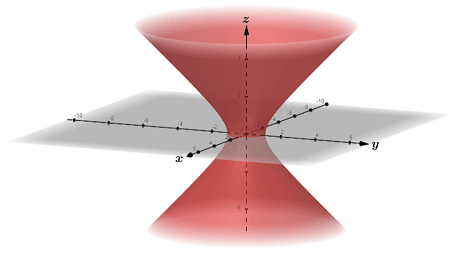
|
|
Contours and gradients
There is a special relationship between the contour map and the gradient field for a function of several variables. Consider the following topographic map:
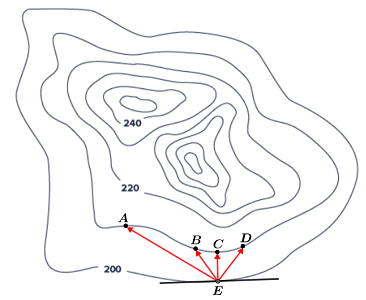
Suppose that you are on some hilly terrain represented by the above topographic map. You start at point E, which is on the level curve with an elevation of 200 feet. You want to climb the shortest possible distance to an elevation of 210 feet. Points A, B, C, and D are several places that you can climb to in order to reach your destination. Referencing the map, EC is the shortest path, and is referred to as the gradient, or gradient vector. The gradient of a function can be thought of as the direction of the function's greatest rate of increase, or in this case, the shortest path to the next contour, or higher elevation.
It is worth noting that since a gradient lies along the direction of a function's greatest rate of change, and contour lines lie along the direction of no change, the two are perpendicular. Referencing the above topographic map, each contour line represents a single elevation. Thus, vector EC, which represents the greatest rate of increase and shortest path to the next contour line (or elevation), is perpendicular to the contour line for the elevation of 200 at point E. Mathematically, let z = f(x, y) be a function of two variables. The gradient field for f is:

If A = (x1, y1) is a point on a level curve for the contour map of f, then ∇f(x1, y1) is perpendicular to the level curve at A. To show this, let  be a unit vector in the direction of the contour line at point A for the contour map of z = f(x, y), shown below:
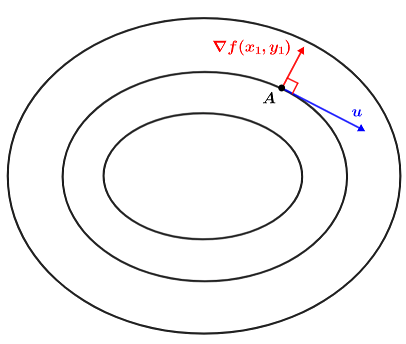
The directional derivative for f at point A can be found using the dot product of the gradient and unit vector:

Since the unit vector is moving in the direction of the contour line at A, it is tangent to the contour line at A such that:

Whenever the dot product of two vectors is zero, they are perpendicular. Since u is tangent to the contour line at A, ∇f(x1, y1) is perpendicular to the contour line at A. The same is true for any gradient at some point on a level curve.
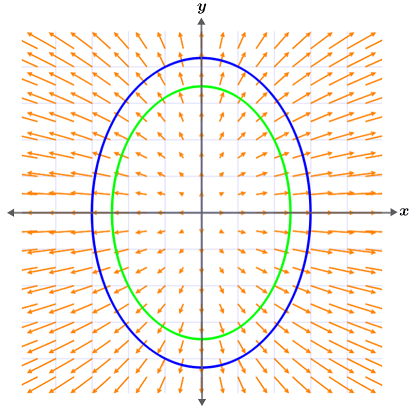
The gradient field and two contours of the paraboloid  are graphed on the xy-plane above. Notice that each gradient that intersects the contours is perpendicular to the contour at the point of intersection.
Example
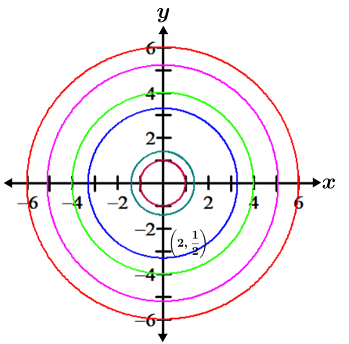
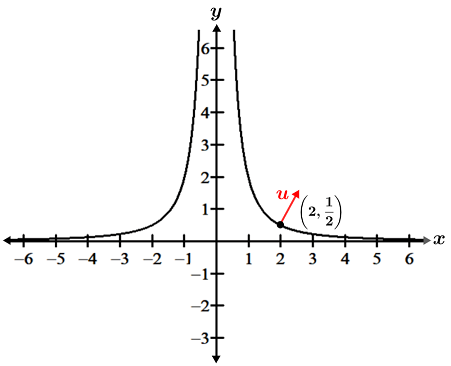
What is the direction of greatest increase for  at f(2, ½).
 ,
,
so the contour containing (2, ½) is yx2 = 2.
The partial derivatives of x and y are:

and

Thus,

and

We can then unitize the gradient vector since doing so does not change its direction:

This unit vector indicates the direction of greatest increase for the function at the given point, as shown in the graph below:
Contour surfaces and gradients
The relationship between a gradient field and contour map for a function of three variables is as follows. Given that w = f(x, y, z) is a function of three variables, then the gradient of f is given by:

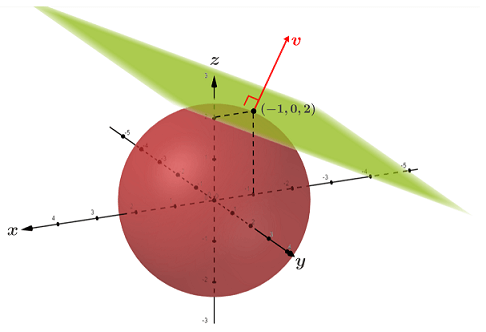
Let k be some constant, then k = f(x, y, z) is the level surface for f (as compared to a level curve for z = f(x, y)). The level surface is also referred to as a contour surface for f. If A = (x1, y1, z1 is a point on a contour surface for f, then ∇f(x1, y1, z1) is perpendicular to the plane tangent to the contour surface at point A. Let's look at an example of this. For the function w = x2 + y2 + z2, the contour surface at (-1, 0, 2) is the sphere 5 = x2 + y2 - z2. The gradient for w is:

The gradient for the contour surface at (-1, 0, 2) is:

The contour surface 5 = x2 + y2 + z2 is shown in red below, along with the gradient vector v: