Key
When used in a graph or a map, a key, also referred to as a legend, is the part that explains the symbols used. Most commonly, keys are drawn off to the side of a graph or below it. Usually this involves drawing all the symbols used then indicating what the symbols represent. In other words, a key includes the variables or objects used in the chart/graph/diagram along with an example (symbol) of what they look like. Below are a couple of examples.
How keys are used
Key of a line chart
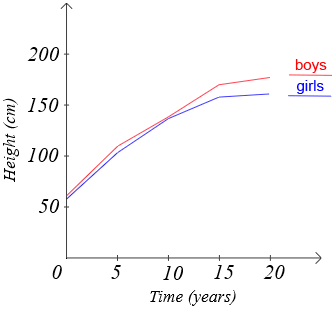
In the above line chart, we can see two lines with different colors. The key for this chart uses a line segments of different colors, then labels each specific color with what it represents. We could have done this other ways too, like using a red and blue circle (or any number of other symbols, as long as we're consistent), rather than a line.
From this key, we know that the red line represents boys while the blue line represents girls, specifically their heights over time.
Key of a map
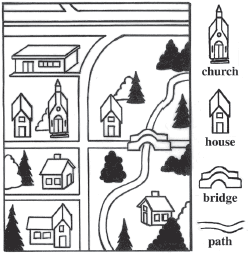
In the map above, we can see a number of types of structures. The key provided is incomplete because there are structures that were not included, but in this example we can see how keys are used to label some of the different structures on the map.