Bar graph
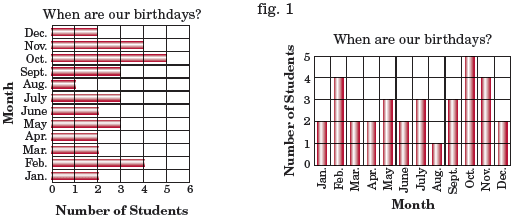
A bar graph (fig.1 ) is a kind of graph that we use to compare categories or groups of information. Bar graphs are usually formed with rectangular bars, and can either be horizontal bar graphs or vertical bar graphs based on whether the bars run left to right, or top to bottom respectively. They can also be formed with real objects, pictures, or symbols.
double bar graph
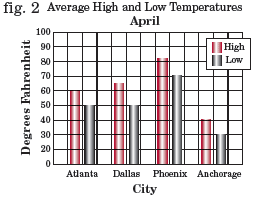
A double bar graph (fig.2) presents two sets of data on the same graph, as shown below.
real graph
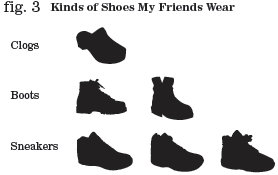
A real graph (fig. 3) is a kind of bar graph that displays the real objects being graphed.
See also line plot, scale.