Sinusoidal
The term sinusoidal is used to describe a curve, referred to as a sine wave or a sinusoid, that exhibits smooth, periodic oscillation. Sinusoids occur often in math, physics, engineering, signal processing and many other areas.
Sinusoidal graph
The term sinusoid is based on the sine function y = sin(x), shown below. Graphs that have a form similar to the sine graph are referred to as sinusoidal graphs.
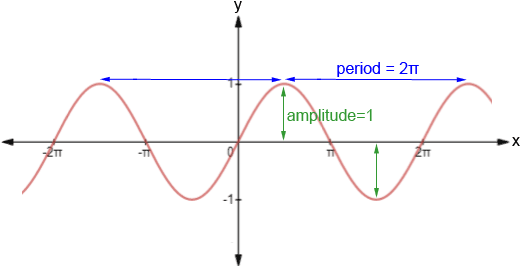
Notice the periodic nature of the sine graph. It repeats every 2π and has smooth curves. Below are some of the properties of the sine function:
- Domain: -∞ < x < ∞
- Range: -1 ≤ y ≤ 1
- Period: 2π – the pattern of the graph repeats in intervals of 2π
- Amplitude: 1 – the sine graph is centered at the x-axis. The amplitude is the distance between the line around which the sine function is centered (referred to here as the midline) and one of its maxima or minima
- Zeros: πn – the sine graph has zeros at every integer multiple of π
- sin(-x) = -sin(x) – the graph of sine is odd, meaning that it is symmetric about the origin
The above quantities are only relevant for the function y = sin(x). While sinusoidal graphs will take on the same form as y = sin(x), the quantities describing the graph, such as amplitude, domain, and range, can vary significantly. This in turn affects how the graph will look. It is also worth noting that the cosine function is a sinusoidal graph, as it is simply the sine function with a horizontal shift.
Graphing sinusoidal functions
Most applications cannot be modeled using y = sin(x), and require modification. The equation below is the generalized form of the sine function, and can be used to model sinusoidal functions. This equation may also be colloquially referred to as the sinusoidal function formula or sinusoidal function equation.
Sinusoidal function formula
y = A·sin(B(x-C)) + D
where A, B, C, and D are constants such that:
 is the period
- |A| is the amplitude
- C is the horizontal shift, also known as the phase shift. If C is positive, the graph shifts right; if it is negative, the graph shifts left
- D is the vertical shift. If D is positive, the graph shifts up; if it is negative the graph shifts down
- the sinusoid is centered at y = D
Consider the following example.
Examples:
1. Graph y = 3sin(2x)
- Period:

- Amplitude: |A| = |3| = 3
- C = 0, so there is no phase shift
- D = 0, so there is no vertical shift
Two periods of the graph are shown below. The graph of y = sin(x) is also shown as a reference.
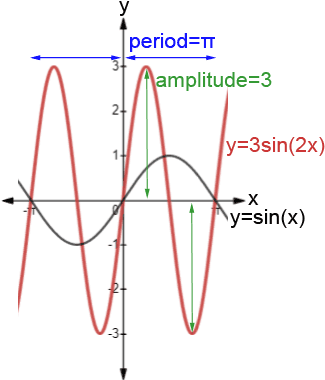
Note how the various quantities affect the shape of the sinusoidal graph as compared to the base graph, y = sin(x).
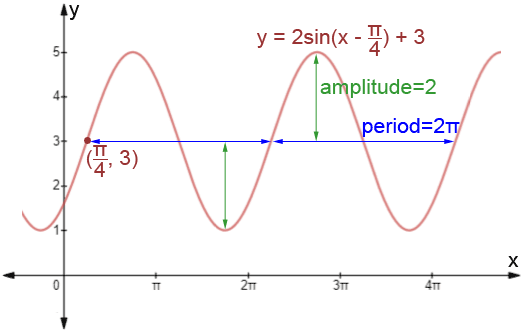
2. Graph y = 2sin(x -  ) + 3.
- Period:

- Amplitude: |A| = |2| = 2
- C = , so the graph shifts right
- D = 3, so the graph shifts up 3
The graph is shown below.
Equation of a sinusoidal curve
Given the graph of a sinusoidal function, we can write its equation in the form y = A·sin(B(x - C)) + D using the following steps.
- D: To find D, take the average of a local maximum and minimum of the sinusoid. y=D is the "midline," or the line around which the sinusoid is centered.
- A: To find A, find the perpendicular distance between the midline and either a local maximum or minimum of the sinusoid. For example, y=sin(x) has a maximum at (
 , 1), and is centered about y=0. Subtracting their y-values yields A = 1 - 0 = 1.
 - B: Examine the graph to determine its period. Choose an easily identifiable point on the sinusoid, such as a local maximum or minimum, and determine the horizontal distance before the graph repeats itself. This is the period of the graph. B=
 .
. - C: To find C, graph the line y=D. Look at the first points left and right of the y-axis where the sinusoid intersects y=D. Choose the point of intersection that precedes a local maximum of the sinusoid (the function is increasing immediately to the right of the point); The x-value of this point is C.
Example:
Write an equation for the sinusoidal graph below.
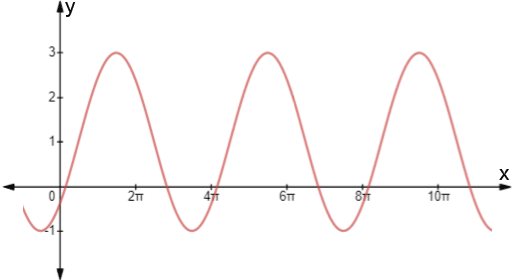
- The maximum value of the graph is 3 and the minimum value is -1, so the equation of the midline is,

- The sinusoid has maximum at y = 3, and D = 1, so
A = 3 - 1 = 2
- There is a maximum at x=
 . The next maximum after that is at x=
 so the period is
  .
.

- The first point at which the sinusoid intersects the line y=1 that precedes a local maximum is .
C=
Substituting all of these into the generalized form of the sine function:

Because of the periodic nature of a sinusoid, the equation for a sinusoidal curve is not unique. We could have found different points for C, such as ( , 1) or (
 , 1), and their equations,

and

would result in the same curve.