Stratified sampling
Stratified sampling is a type of probability sampling in which a statistical population is first divided into homogeneous groups, referred to as strata. A sample is then collected from each strata using some form of random sampling. The figure below depicts the process of dividing a population into strata which are then randomly sampled to produce a stratified sample:

The strata can be classified based on any shared characteristic(s), such as gender, age, ethnicity etc., as long as each member of the population belongs within only 1 stratum. Stratified sampling is advantageous when researchers want to know more about the population based on specific characteristics. Unlike other sampling methods, such as simple random sampling (SRS), stratified sampling ensures that members of the population with specific characteristics will be represented within the sample. This is not the case in SRS, since the randomness of the selection method can entirely exclude certain groups in the population.
Stratified sampling is also useful when the expected outcome of an experiment varies based on the groups within the population. For example, in a study of memory loss in adults, a researcher suspects that elderly men are more likely to suffer from memory loss than other adults in the study. The researcher divides the population into groups of men and women of varying ages (the strata) and randomly samples the strata to study the effects of age and gender on memory loss. In comparison, a simple random sample would not be as effective because each member of the population has an equal probability of being chosen for the sample. Thus, the sample would be highly unlikely to contain a balanced distribution of men and women of a specific age.
Constructing a stratified sample
The following steps can be used as a guideline for constructing a stratified sample.
Step 1: Defining the population and strata
Like other sampling methods, the first important step is to clearly define the population from which the sample will be taken. The groups that the population is divided into must be clear. This is because each element in the population can only belong to a single group, so the criteria for membership in a particular group must be obvious. In other words, each strata must be mutually exclusive. For example, the figure below depicts the 8 groups that a population of high school students can be divided into based on sex and grade level:
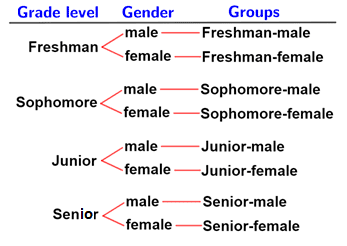
Students from a population of high schoolers can only be placed in one of the eight groups. A male who is a junior cannot also be categorized as a freshman male, sophomore male, junior female, etc. This ensures that each student can only be placed within one group.
Step 2: Divide the population into strata
Once the strata have been defined, the next step is to collect information about each element in the population so that each element can be placed into the appropriate stratum. Referencing the example above, researchers would need to determine the sex and grade level of each student to place them.
Step 3: Choose a sample size
Researchers can choose whether or not to select samples from each stratum proportionately or disproportionately. In a proportionate sample, the number of elements selected from each stratum is proportional to its representation within the population. For example, if a particular stratum comprises 20% of the population and the chosen sample size is 100, 20 elements would be selected from the stratum.
In a disproportionate sample, the number of elements selected from each stratum does not need to be proportional to its representation within the population. An example of a disproportionate sample is one in which the same number of elements are selected from each stratum even though each stratum is not equally represented in the population. For example, there may be 50 freshmen, 72 sophomores, 48 juniors, and 88 seniors in a high school. If 10 students are selected from each stratum, the sample is disproportionate.
Example
A company that has 10,000 employees wants to examine whether age affects whether or not its employees contribute to their retirement accounts. The number of employees in each respective age group is shown in the table below:
| Age | # of employees |
|---|---|
| < 25 | 1200 |
| 25-37 | 3600 |
| 38-50 | 2700 |
| 51-62 | 1100 |
| > 62 | 1400 |
Given that the company collects a proportional sample of 100 employees, use the following formula to determine the number of employees to select from each age group:

< 25:

25-37:

38-50:

51-62:

> 62:

Selecting an appropriate sample size can be difficult. A sample size that is too small will not adequately represent each stratum or the population as a whole. If the sample does not represent the population, any conclusions or inferences made about the population will not be statistically valid. On the other hand, a sample size that is too large may be too costly, or data may be too difficult to collect and analyze. Thus, the sample size must be large enough, but not too large such that collecting the sample becomes too expensive or impractical.
Randomly sample the strata
The final step is to randomly sample each stratum. There are many different methods for random sampling, the most common of which is referred to as simple random sampling (SRS). Other methods, such as systematic sampling, may also be used. Depending on the study, certain methods are more effective than others, so it is important for researchers to understand the various random sampling methods; doing so allows researchers to select the most appropriate method for the given situation.