Chi square
The term "chi-square" (denoted χ2) is used to describe a type of statistical distribution, hypothesis test, and test statistic. A chi-square statistic is a test statistic used as part of a chi-square test to determine whether a relationship exists between two variables. The distribution of chi-square statistics forms the chi-square distribution, the graph of which is dependent on the degrees of freedom (df), as shown in the figure below:
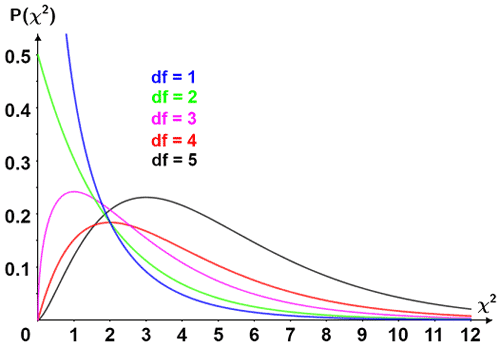
The chi-square distribution has the following properties (among others):
- Domain: 0 < χ2 < ∞
- The mean (μ) of the distribution is equal to the degrees of freedom (df), or μ = df
- The degrees of freedom affects the shape of the curve; as df increases, the curve becomes more symmetrical, approaching a normal distribution at a larger degrees of freedom
The total area under the curve of a chi-square distribution sums to 1. Given some chi-square statistic, a, the area under the curve between 0 and a is the cumulative probability between those two points, and represents the probability that a chi-square statistic will fall between 0 and a.
Chi-square statistics and their associated probabilities are computed either by using various software to calculate the integral of the probability density function between the points of interest, or by using chi-square tables. Chi-square tables are widely available tables that provide the values of the cumulative distribution function of a chi-square distribution. They can be used to find the probability of an observed value being between some range of values.
A chi-square table may take different forms, so it is important to identify which type of chi-square table is available in order to correctly determine various probabilities. A chi-square table includes the p-value, usually in the top row or bottom row of the table. The values in the table are chi-square values, and the degrees of freedom is indicated by a column on the left. The table is used to determine the chi-square value for a given p-value and degrees of freedom such that those values with p-value less than 0.05 are considered statistically significant, while those greater than 0.05 are considered not significant. The figure below shows one type of chi-square table (upper-tail critical value table) for 10 degrees of freedom.
| Degrees of freedom (df) | χ2 value | ||||||||||
|---|---|---|---|---|---|---|---|---|---|---|---|
| 1 | 0.004 | 0.02 | 0.06 | 0.15 | 0.46 | 1.07 | 1.64 | 2.71 | 3.84 | 6.63 | 10.83 |
| 2 | 0.10 | 0.21 | 0.45 | 0.71 | 1.39 | 2.41 | 3.22 | 4.61 | 5.99 | 9.21 | 13.82 |
| 3 | 0.35 | 0.58 | 1.01 | 1.42 | 2.37 | 3.66 | 4.64 | 6.25 | 7.81 | 11.34 | 16.27 |
| 4 | 0.71 | 1.06 | 1.65 | 2.20 | 3.36 | 4.88 | 5.99 | 7.78 | 9.49 | 13.28 | 18.47 |
| 5 | 1.14 | 1.61 | 2.34 | 3.00 | 4.35 | 6.06 | 7.29 | 9.24 | 11.07 | 15.09 | 20.52 |
| 6 | 1.63 | 2.20 | 3.07 | 3.83 | 5.35 | 7.23 | 8.56 | 10.64 | 12.59 | 16.81 | 22.46 |
| 7 | 2.17 | 2.83 | 3.82 | 4.67 | 6.35 | 8.38 | 9.80 | 12.02 | 14.07 | 18.48 | 24.32 |
| 8 | 2.73 | 3.49 | 4.59 | 5.53 | 7.34 | 9.52 | 11.03 | 13.36 | 15.51 | 20.09 | 26.12 |
| 9 | 3.32 | 4.17 | 5.38 | 6.39 | 8.34 | 10.66 | 12.24 | 14.68 | 16.92 | 21.67 | 27.88 |
| 10 | 3.94 | 4.87 | 6.18 | 7.27 | 9.34 | 11.78 | 13.44 | 15.99 | 18.31 | 23.21 | 29.59 |
| p-value | 0.95 | 0.90 | 0.80 | 0.70 | 0.50 | 0.30 | 0.20 | 0.10 | 0.05 | 0.01 | 0.001 |
The table provides the chi-square value to the right of the critical value, α; in other words, it is the area under the chi-square distribution to the right of α and represents the probability of observing a value within the described interval. The area left of the critical value can be found as 1 - α; for a two-tailed test, the probability for the right tail can be found as α/2 and the probability for the left tail can be found as 1 - α/2. This is further described in the section below.
Chi-square test and statistic
A chi-square statistic is a test statistic computed as part of a chi-square test. A chi-square test is a type of hypothesis test used to determine whether a relationship exists between two variables. In general, a chi-square test is used over other statistical hypothesis tests such as a z-test or t-test in cases where we just want to determine whether any relationship exists between variables. This is in contrast to a z-test or t-test in that z-tests and t-tests specifically compare the population mean of one group to another to determine whether the population means are less than, greater than, or not equal to that of the other group.
Like other statistical hypothesis tests, to use a chi-square test, the observations must be independent. The null hypothesis for a chi-square test is generally that no relationship exists between the variables being compared; the alternative hypothesis is that some relationship does exist. A chi-square test is typically used to help determine whether the differences between the observed and expected results are due to random chance or some relationship between the variables. There are a few different types of Chi-square tests, the most commonly used of which is Pearson's chi-square test.
Pearson's chi-square test
Pearson's chi-square test is used to compare goodness of fit, homogeneity, and independence of categorical data, where categorical data describes a variable that can take on one of a limited number of possible values. The chi-square statistic, χ2, for a chi-square test is defined as follows:

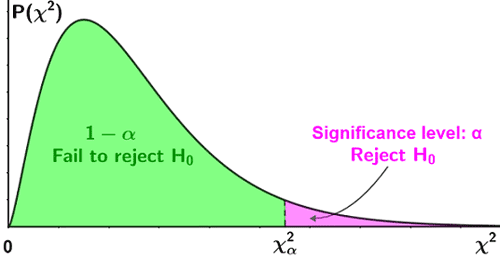
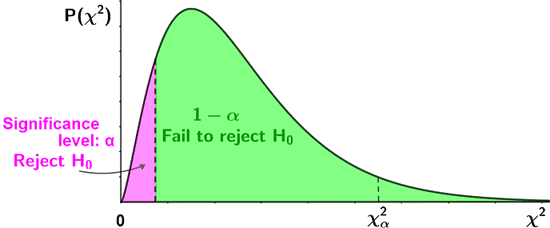
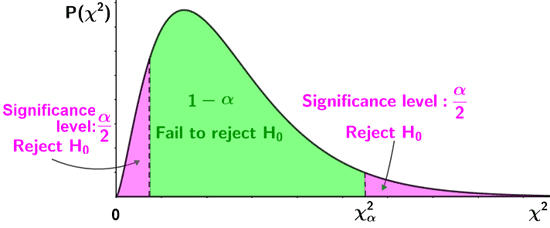
where Oi are the observed value(s) and Ei are the expected value(s). As part of the test, the chi-square statistic is compared to a critical value to determine whether a significant difference exists. If the test results indicate that a significant difference exists, the null hypothesis that the frequency distribution of the observed values is consistent with the expected values for the corresponding population is rejected, providing evidence for the alternative hypothesis. The following figure shows the criteria for accepting or rejecting the null hypothesis for a lower-tailed, upper-tailed, and two-tailed test, based on whether the test statistic lies within the critical region shown in pink.
| One-tailed tests | |
|---|---|
| Upper-tailed test |
|
| Lower-tailed test |
|
| Two-tailed test | |
|
|