Z-test
A Z-test is a type of statistical hypothesis test used to test the mean of a normally distributed test statistic. It tests whether there is a significant difference between an observed population mean and the population mean under the null hypothesis, H0.
A Z-test can only be used when the population variance is known (or can be estimated with a high degree of accuracy), or if the sample size of the experiment is large (typically n>30). Also, the test statistic must exhibit a normal distribution; if it exhibits a distribution that is clearly not normal, the Z-test is not applicable. In many cases, population parameters may not be known, or it may not be possible to estimate them accurately. In such cases, or in cases where the sample size is small, a Student's t-test is more appropriate.
How to conduct a Z-test
The procedure for conducting a Z-test is similar to that of other statistical hypothesis tests, and is generally as follows:
- State the null (H0) and alternative hypotheses (Ha).
- Select a significance level, α.
- Calculate the Z-score.
- Determine the critical value(s) of Z or the p-value.
- Compare the Z-score of the observed value to the critical value of Z (or compare the p-value to α) to determine if the null hypothesis should be rejected in favor of the alternative hypothesis, or if the null hypothesis should not be rejected.
H0 and Ha
The null hypothesis is typically a statement of no difference. For example, assume that the average score received on the SAT by high schoolers in a given state was a 1200 with a known standard deviation. If the average score of students in a given high school is a 1230, we may use a Z-test to determine whether this result is better, statistically, than the state average. The null hypothesis in this case would be that the average score of students in the high school is not better than the state average, or H0: μ ≤ μ0, or μ ≤ 1200.
The alternative hypothesis is a statement of difference from the null hypothesis. It can take one of three forms:
- Given H0: μ ≤ μ0, Ha: μ > μ0
- Given H0: μ ≥ μ0, Ha: μ < μ0
- Given H0: μ = μ0, Ha: μ ≠ μ0
In this example, it is believed that a score of 1230 is statistically significant, and that students in this high school performed better than the state average. Therefore, the alternative hypothesis takes on the first form in the list, Ha: μ > μ0, or μ > 1200.
Significance level
The significance level, α, is the probability of a study rejecting the null hypothesis when the null hypothesis is true. Commonly used significance levels include 0.01, 0.05, and 0.10. A significance level of 0.05, or 5%, means that there is a 5% chance of concluding that a difference exists (thus rejecting H0) when there is no actual difference. The lower the significance level, the more evidence required before the null hypothesis can be rejected. The significance level is compared to the p-value: if a p-value is less than the significance level, the null hypothesis is rejected in favor of the alternative hypothesis.
Z-score
Calculating a Z-score is a necessary part of conducting a Z-test. A Z-score indicates the number of standard deviations that an observed value is from the mean in a standard normal distribution. For example, an observed value with a Z-score of 1.2 indicates that the observed value is 1.2 standard deviations from the mean. If the population mean and standard deviation are known, the Z-score is calculated using the following formula:

where μ is the mean of the population, σ is the standard deviation of the population, and x is the observed value. In many cases the population mean and standard deviation are not known. In such cases, these population parameters can be estimated using a sample mean and sample standard deviation, and the Z-score can be computed as follows:

where x is the sample mean, s is the sample standard deviation, and x is the observed value.
Critical value and p-value
Once a Z-score has been calculated, there are two methods for drawing conclusions about the test statistic: using the critical value(s), or using a p-value. To form a conclusion for a hypothesis test using a critical value, the Z-score of the observed value is compared to the critical value(s) of the selected significance level; to use a p-value, the p-value of the observed value is compared to the significance level.
Critical value
A critical value is a value that indicates the critical region(s) (or rejection region) of the standard normal distribution, where a critical region is the area of the distribution in which a value must lie in order to reject the null hypothesis.
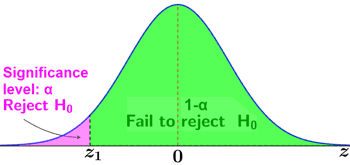
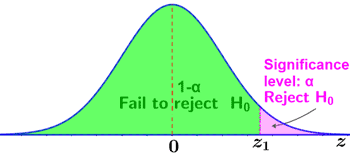
The critical value is dependent on the significance level as well as whether a one-tailed or two-tailed test is being conducted. A one-tailed test is used when we want to know if a value is significantly larger or smaller than the Z-score. There is only one critical region in a one-tailed Z-test. It is either a left-tailed test (or lower-tailed) or right-tailed test (or upper-tailed) based on the position of the critical region, as shown in the figure below.
|
|
The critical regions are shown in pink. If a test statistic lies within the pink region, the null hypothesis is rejected in favor of the alternative hypothesis. Otherwise, the null hypothesis is not rejected.
A two-tailed Z-test is used when the goal is to determine if any difference exists between the populations being compared. The critical regions in a two-tailed test occur on both ends of the distribution, with the significance level being divided between the two. For example, for a significance level of 0.05, the area comprised by each critical region is 0.025. The figure below shows the graph of a two-tailed Z-test.
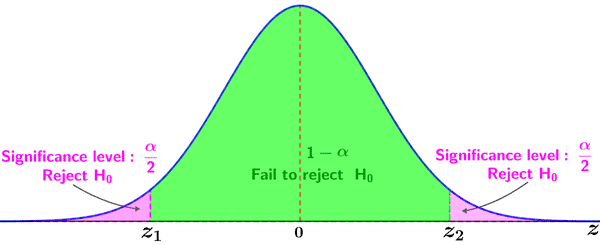
If a test value lies in either of the critical regions shown in pink, the null hypothesis is rejected in favor of the alternative hypothesis; if it lies within the green region, the null hypothesis is not rejected.
After selecting the significance level and type of test, the critical Z value can be determined using a Z table by finding the Z value that corresponds to the selected significance level. For example, for a one-tailed test and a significance level of 0.05, find the probability closest to 0.05 and read the Z value that results in this probability; the Z value for α = 0.05 for a one-tailed Z-test is -1.96 for a left-tailed Z-test and 1.96 for a right-tailed Z-test. For a two-tailed Z-test, divide α by 2, then determine the corresponding Z-value. For α = 0.05, each tail will comprise an area of 0.025 in the standard normal distribution, which corresponds to Z-values of -1.645 and 1.645. Thus, the critical regions are Z < -1.645 and Z > 1.645. The critical values for common significance levels are shown in the table below:
| Critical value | |||
|---|---|---|---|
| α | Left-tailed | Right-tailed | Two-tailed |
| 0.01 | -2.326 | 2.326 | ± 2.576 |
| 0.05 | -1.645 | 1.645 | ± 1.96 |
| 0.10 | -1.282 | 1.282 | ± 1.645 |
p-value
The p-value indicates the probability of obtaining test results that are at least as extreme as the observed results, assuming that the null hypothesis is true. It tells us how likely it is for an outcome to occur solely based on chance. For example, a p-value of 0.05 means that there is a 5% chance that an outcome occurred solely by chance. The smaller the p-value, the less likely it is for an outcome to occur solely by chance, and the more evidence there is to reject the null hypothesis.
Like critical values, a p-value can be determined using a Z table. For a left-tailed Z-test, the p-value is the area under the standard normal distribution to the left of the Z-score of the observed value; for a right-tailed Z-test, it is the area to the right of the Z-score; for a two-tailed Z-test, it is the sum of the area to the left and right of the Z-score. If the p-value is less than or equal to the significance level, the null hypothesis is rejected in favor of the alternative hypothesis. Otherwise, the null hypothesis is not rejected.
It is important to note that the p-value is not the probability that the null hypothesis is true. It is the probability that the data could deviate from the null hypothesis as much, or more than it did. The calculation of the p-value assumes that the null hypothesis is true, so it is not a measure of whether or not the null hypothesis is correct. Rather, it is a measure of how well the data fits the null hypothesis. Also, the p-value (or critical value) may provide evidence that the null hypothesis should be rejected in favor of the alternative hypothesis at the chosen level of significance. This does not mean that the alternative hypothesis is being accepted, because it is possible that the null hypothesis would not be rejected at a different significance level. Similarly, if the p-value is greater than the significance level, this does not mean that the null hypothesis is being accepted, just that the null hypothesis is not rejected.
Finally, p-values and critical values only indicate statistical significance, and may not necessarily indicate that the study's findings are significant within their context. For example, if a new medicine and a placebo are tested on different populations, and the medicine is found to have a statistically significant effect, it may not necessarily mean that there is clinical significance. It is possible for a finding to be both statistically and clinically significant, or only one or the other. For large sample sizes, it is possible for results to indicate statistical significance even when the effect is actually small and unimportant. Conversely, a small sample may not exhibit statistical significance even when the effect is large and potentially important. Thus, it is important to fully understand the scope of a study, as well as the statistical methods used, in order to effectively interpret the results and draw accurate, unbiased conclusions.
Example
The average score on a national mathematics exam taken by high school seniors is an 82 with a standard deviation of 8. A sample of 1000 seniors achieved an average score of 68. Perform a Z-test to determine whether there is a statistically significant difference between the national average and that of the sample of seniors at a significance level of 0.05.
We want to determine whether there is any difference, so the null hypothesis is that there is no difference, or
H0: μ = 82
and the alternative hypothesis is:
Ha: μ ≠ 82
Thus, a two-tailed Z-test should be conducted since differences on either side of the distribution must be accounted for.
The selected significance level is:
α = 0.05
This value must be greater than the p-value in order to conclude that the difference in scores is statistically significant.
Since the population standard deviation and mean are known, the Z-score can be computed as:

Based on the selected significance level and the use of a two-tailed Z-test, the critical values are Z = ± 1.96. Since the Z-score of the observed value lies between both tails (rather than within one of them), we fail to reject the null hypothesis, as depicted in the figure below.
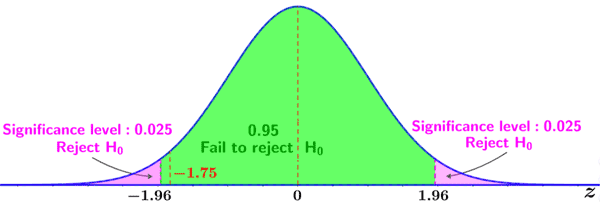
Thus, we conclude that the difference between the observed mean and the population mean is not statistically significant for a significance level of 0.05.
However, had we selected a significance level of 0.10, the critical values would be Z = ±1.645, and Z = -1.75 would lie within the left tail of the distribution. In this case, we would reject the null hypothesis in favor of the alternative hypothesis, and conclude that the observed value is statistically significant for a significance level of 0.10.
The above discussion involved hypothesis testing for one sample, where an observed value was compared to the expected population parameter. In certain cases, scientists may want to compare the means of two samples. In such cases, a two-sample Z-test is used instead.
Two-sample Z-test
A two-sample Z-test is conducted using the same procedures described above for a one-sample Z-test, with the exception that the Z-score is computed using the following formula:

where μ1 and μ2 are the means of the two respective populations, x1 and x2 are the sample means, and n1 and n2 are the sample sizes.
Example
Researchers want to test whether a certain drug has any effect on the scores received by patients who are administered the drug prior to performing a physical stress test. The researchers place patients into 2 groups: 500 are placed into the experimental group and are administered the drug; 300 are placed into the control group and are administered a placebo. Both groups then perform the physical stress test, the results of which are as follows:
| Experimental group: | x1 = 50; σ1 = 16; n1 = 100 |
| Control group: | x2 = 45; σ2 = 13; n2 = 150 |
Determine whether or not there is a statistically significant difference between the two groups at a significance level of 0.05.
The null hypothesis is that there is no difference, so:
H0: μ1 = μ2
Also, since it is assumed that the null hypothesis is true, μ1 - μ2 = 0.
The alternative hypothesis is that there is a difference, so:
Ha: μ1 ≠ μ2
The selected significance level is 0.05, and we conduct a two-tailed test since we are looking for any observable difference.
The Z-score is then calculated as follows:

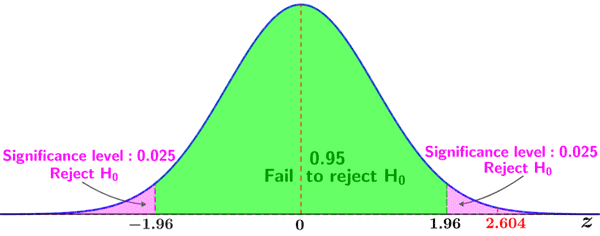
Using a Z table (or a p-value calculator), the p-value for a two-tailed Z-test for a Z-score of 2.604 is 0.009214. Since the p-value is less than the selected significance level, we reject the null hypothesis in favor of the alternative hypothesis, and conclude that the drug has a statistically significant effect on the performance of the patients. Since the Z-score lies in the right tail, we may conclude that patients who received the drug scored significantly better than those who received the placebo. If the Z-score were to lie in left tail, we would conclude the opposite: that patients who received the drug performed significantly worse.
We could also have used the critical values Z = ±1.96 for a significance level of 0.05 to reach the same conclusion, since 2.604 lies within the critical region denoted by the right tail of the distribution, as shown in the figure below.