Z table
A Z table, also referred to as a standard normal table, is a table of the values of the cumulative distribution function of a normal distribution. It tells us the probability that values in a normal distribution lie below, above, or between values on the standard normal distribution. This is useful because, typically, it is necessary to integrate the probability density function (pdf) of a random variable to determine the probabilities of outcomes within an interval; for the case of a normal distribution, this is particularly difficult. However, since all normal distributions can be converted to a standard normal distribution, and since the associated probabilities have already been computed and compiled into Z tables for a standard normal distribution, it is possible to reference Z tables rather than having to integrate the pdf to determine the probability of outcomes within a given interval occurring.
Z-scores and Z distributions
A normally distributed random variable can be standardized by converting its values to Z-scores using the following formula,

where μ is the mean, σ is the standard deviation, and x is the value being converted. The resulting distribution of Z-scores is referred to as a Z distribution (or standard normal distribution), where the Z-score represents the number of standard deviations (not the value of the standard deviation) that a given value is from the mean. For example, a Z-score of 1 means that the value is 1 standard deviation from the mean. A Z-score is used to determine where an observed value lies in a distribution, relative to its mean, and can be positive, negative, or 0:
- A positive Z-score indicates that a value is above (right of) the mean.
- A negative Z-score indicates that a value is below (left of) the mean.
- A Z-score of 0 indicates that a value is equal to the mean.
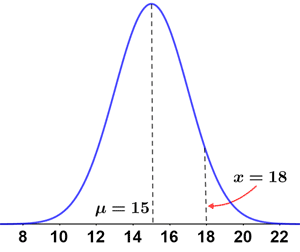
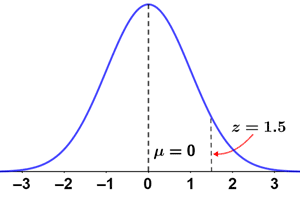
The figure below shows a normal distribution with μ = 5, σ = 4, and x = 11, as well as its corresponding Z distribution. The x-value (and all values in the normal distribution) is standardized as follows:

| Normal distribution | Z distribution |
|---|---|
|
|
Standardization allows us to easily compare scores from different normal distributions. Two different normal distributions have different means and standard deviations, which affect the shape of the graph, making it difficult to compare them. Converting these normal distributions to a Z distribution allows for a direct comparison of the distributions, since the differences based on mean and standard deviation are removed.
Using a Z table
There are a few different types of Z tables (described below). Generally, the process of using a Z table involves first calculating a Z-score for the value of interest. Once this is done, different Z tables can be used to determine various probabilities by finding the probability associated with the Z-score of the value of interest. Below is an example of a cumulative from mean Z table:
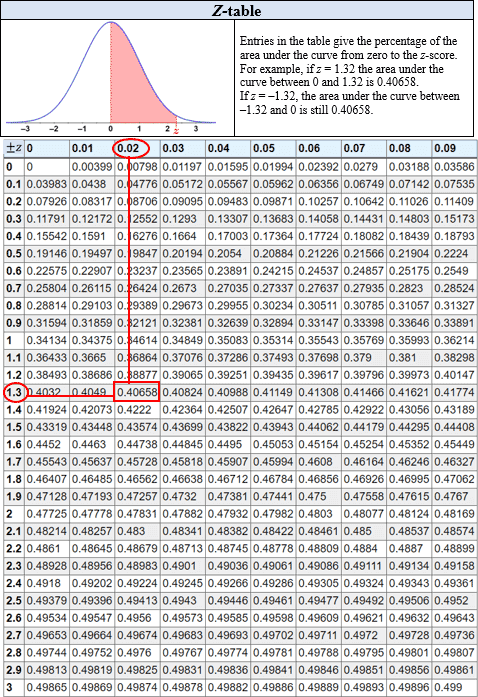
Reading the Z table for Z = 1.32, the probability that a value lies between a Z-score of 0 and 1.32 is approximately 41%.
Example
The average score on a math exam for a class of 150 students was a 78/100 with a standard deviation of 6. Use a cumulative from mean Z table to find the probability of a score being above or below an 87.
First, convert 87 to a Z-score:

Referencing the above Z table, a Z-score of 1.5 corresponds to a probability of 0.43319, or around 43%. However, this probability only represents the probability from the mean to the Z-score, as shown in the figure below:
Since 50% of values lie above and below the mean, the probability that a score will be below an 87 is represented by the following distribution:
Therefore, P(Z < 1.5) is:

The remaining unshaded area of the curve in the figure above represents P(Z > 1.5), and can be found by subtracting P(Z < 1.5) from 1:

Thus, approximately 93% of scores were below an 87, and only 7% of scores were above an 87.
Types of Z tables
There are a few different types of Z tables that provide the probabilities of various Z distributions: cumulative from mean, cumulative, and complementary cumulative.
Cumulative from mean
A cumulative from mean Z table provides the probability that a statistic lies between 0 (the mean) and z1, or P(0 < Z < z1), as represented by the area in the figure below:
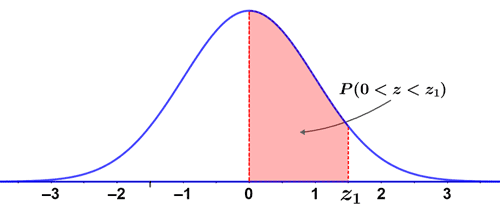
Using a cumulative from mean Z table, it is possible to find various probabilities. The simplest probability to determine is the probability that an outcome is in the interval 0 < Z < z1, since that is what the table represents.
It is also possible to calculate other probabilities using a cumulative from mean Z table, such as P(Z > z1), by adding or subtracting the appropriate areas under the curve. For example, to determine P(Z > z1) subtract P(0 < Z < z1) from 50%, since a Z distribution has 50% of its values above and below the mean.
Thus, subtracting the area represented by P(0 < Z < z1) from the total area in the right side of the graph will yield P(Z > z1). Alternatively, this probability can be directly read off a complementary cumulative Z table (described below). As can be seen, there are a number of ways to determine various probabilities using Z tables. As such, it is important to be aware of the type of Z table being used.
Cumulative
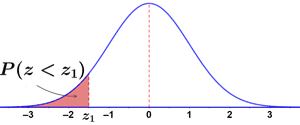
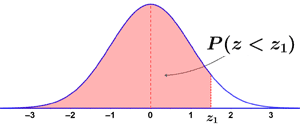
A cumulative Z table provides the probability that a statistic is less than Z, or P(Z < z1). The two graphs below show the area under the Z distribution represented by P(Z < z1).
|
|
Using a cumulative Z table, the probabilities can simply be read off the table for the given values of z1. Like any Z table, the cumulative Z table can be used to determine other probabilities as well. For example, P(Z > z1) can be determined by subtracting P(Z < z1) from 1, since the entire area under the curve is 1. This leaves only the area P(Z > z1).
Complementary cumulative
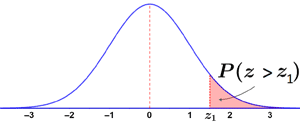
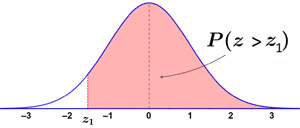
A complementary cumulative Z table provides the probability that a statistic is greater than Z, or P(Z > z1). This can be found as 1 - P(Z < z1). The two graphs below show the area under the Z distribution represented by P(Z > z1):
|
|
As with the other types of distributions, it is possible to use a complementary cumulative Z table to find other probabilities, such as P(Z < z1), by subtracting P(Z > z1) from 1. As can be seen, it is possible to find various probabilities with each of the types of Z tables; the key is to be aware of which type of Z table is available and what distributions it represents.