p-value
The p-value is a value that is used as part of a hypothesis test. Assuming that the null hypothesis is true, the p-value is the probability of obtaining test results that are at least as extreme as the observed results. It takes on values between 0 and 1 and indicates how likely it is to obtain a result based on random chance. For example, a p-value of 0.01 means that there is a 1% chance that a result occurred by random chance, given that the null hypothesis is true. Thus, a low p-value provides evidence for rejecting the null hypothesis in favor of the alternative hypothesis, since it indicates that it is highly unlikely that the outcome could occur if the null hypothesis were true.
In order to draw conclusions concerning the null hypothesis, the p-value is compared to a selected significance level (α). α is the probability of rejecting the null hypothesis given that the null hypothesis is true. Results are considered statistically significant when the p-value allows us to reject the null hypothesis, which occurs for p-values less than or equal to the significance level, or:
p ≤ α
Most commonly, α is set to 0.05, though lower levels of α (such as 0.01) are also used. Note that the value of α must be set prior to examining the data and calculating a p-value, since it is the value to which the p-value is compared. Thus, it would not make sense to select a significance level after the p-value is already known. Generally, p-values are considered to have the following range of statistical significance:
| p-value | Significance |
|---|---|
| p ≥ 0.05 | Not significant |
| 0.01 ≤ p < 0.05 | Significant |
| 0.001 ≤ p < 0.01 | Very significant |
| p < 0.001 | Highly significant |
As the p-value gets smaller, the outcome becomes more statistically significant, and the evidence against the null hypothesis increases.
How to determine the p-value
In order to determine a p-value, there must be a null hypothesis, a test statistic, and data. In addition, it is necessary to determine whether to use a one or two-tailed test; this is usually based on the null and alternative hypotheses. Depending on the distribution of the data, various hypothesis tests may be used, such as a t-test, Z-test, F-test, and chi-squared test. If the distribution of the data is a common distribution, such as a normal distribution, tables exist that can be used to determine the p-value. In many cases however, the computation of the p-value is conducted using statistical software and numeric methods. The example below involves normally distributed data with known population parameters, so a Z-test and Z table may be used to determine the p-value.
Example
A machine fills bottles with a certain over-the-counter drug. Each bottle is meant to be filled with 150 pills. A sample of 500 bottles is found to have an average of 160 pills in each bottle. Conduct a Z-test and determine whether it is statistically significant at a significance level of 0.05 given that the population (all bottles filled by the machine) standard deviation is 4.
The available data makes the use of a Z-test appropriate, since the data is normally distributed, and the population mean and standard deviation are known. The null hypothesis in this case is
H0: μ = μ0 = 150
and the alternative hypothesis is therefore:
Ha: μ > 150
In other words, we expect that there should be an average of 150 pills in each bottle, and want to determine whether our sample with an average of 160 pills per bottle is statistically significant and provides evidence against the null hypothesis. We can determine this by conducting a Z-test and comparing the p-value of the observed value (160) to the significance level of 0.05.
Conducting a Z-test involves the computation of a Z-score, which, in this case, can be calculated using the following formula:

where μ is the mean, σ is the standard deviation, and x is the observed value. Thus:

Based on the central limit theorem, many measurable quantities can be modeled by a normal distribution, and all normal distributions can be converted to a standard normal distribution (or Z distribution). In large part due to this, tables (referred to as Z tables for a Z distribution) have been compiled that provide the probability that values in a normal distribution lie below, above, or between values on the standard normal distribution. These tables can in turn be used to determine the p-value for a normally distributed random variable by looking up the appropriate probability.
For this example, we conduct a one-tailed test since we are only concerned with determining whether the observed value provides evidence that the number of pills in each bottle is significantly larger than the expected value. Referencing a Z-table, we therefore want to determine the probability of obtaining a value greater than or equal to the Z-score of the observed value, or P(Z ≥ 2.5) which works out to:
P(Z ≥ 2.5) = 0.00621
Refer to the Z table page for more information on how to use a Z-table. Based on the result, there is only a 0.621% chance of obtaining a value greater than or equal to 160, which is significantly less than α = 5%. This provides evidence for rejecting the null hypothesis in favor of the alternative hypothesis, and we may infer that the average number of pills in a bottle is significantly higher than expected.
The criteria for rejecting or failing to reject the null hypothesis based on the p-value are depicted in the figures below.
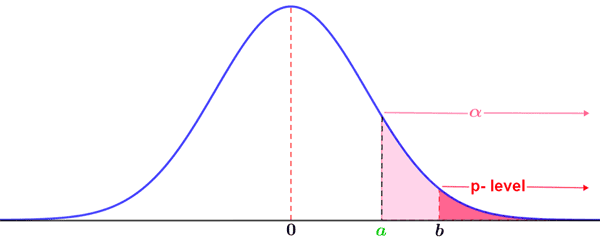
The above figure illustrates a case in which the null hypothesis would be rejected. The shaded area under the curve to the right of a indicates the area corresponding to the significance level, α, within which lie p-values that would lead to rejection of the null hypothesis. The area to the right of b is the p-value. Since the area covered by the p-value (and therefore the probability) is smaller than that indicated by the selected significance level, the null hypothesis is rejected.
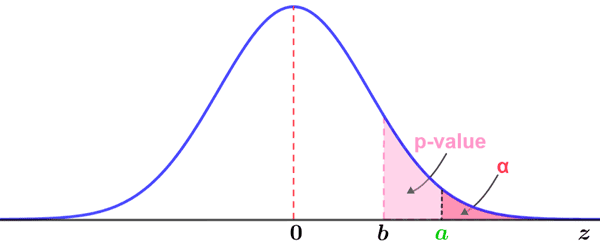
In contrast, the following figure depicts a case in which the p-value is indicated by an area larger than that indicated by the significance level. Thus, there is insufficient evidence to reject the null hypothesis, since the p-value comprising a larger area than that of the significance level means that there is a larger probability than the significance level that the observed value occurred by chance.
Common misunderstandings
The meaning of a p-value is sometimes misinterpreted. Due to its widespread use in statistics, it is worth noting some of the common misunderstandings.
- The p-value is sometimes interpreted as the probability that the null hypothesis is true, or that the alternative hypothesis is false. These are not correct interpretations of the p-value. The calculation of a p-value is computed under the assumption that the null hypothesis is true. Thus, it cannot reflect the probability of the null hypothesis being true. Furthermore, while the null hypothesis is assumed to be true as part of statistical hypothesis testing, it is not possible to prove that a null hypothesis is definitively true, so probabilities are not attached to the null or alternative hypotheses.
- The p-value does not provide the probability that the observed value occurred by random chance alone; it is the probability that this observed value occurred by random chance under the assumption that the null hypothesis is true. This distinction is important because the p-value is tied to the null hypothesis or whatever other model is being used, and does not have meaning outside of these constraints.
- The p-value should not be used to accept the alternative hypothesis simply because it is less than the significance level 0.05. Although the significance level of 0.05 is widely used, it is just a convention. A p-value less than 0.05 provides evidence that the result is statistically significant, and provides evidence to consider the alternative hypothesis. However, there should be other supporting evidence if the alternative hypothesis is to be accepted. A p-value less than 0.05, alone, does not provide sufficient evidence to accept the alternative hypothesis.
- A p-value does not indicate anything about the practical effects of an observed difference. A small p-value only indicates that an observed value is statistically significant. Given the example of a clinical trial testing the effects of a new drug and a placebo, a small p-value may indicate that an observed value is statistically significant. However, this does not necessarily mean that the observed effect has clinical significance. For example, the new drug may have an effect that is statistically significant, but the actual effect on the patient may be so small that it is not clinically important. Thus, one should not necessarily interpret statistical significance as the study results being meaningful.