Cumulative frequency
A cumulative frequency is the sum of the observations in a class (grouping of values, e.g. 0-5 year olds, 6-10 year olds, etc.) and all of the observations in the classes below it. It is an extension of a frequency distribution. Below is a cumulative frequency distribution (or table) in which the classes represent the test scores of students in a statistics class. Without the "cumulative frequency" column, the table would simply be referred to as a frequency distribution.
| Class interval | Frequency | Cumulative frequency |
|---|---|---|
| 44-50 | 1 | 1 |
| 51-58 | 2 | 3 |
| 59-66 | 5 | 8 |
| 67-74 | 7 | 15 |
| 75-82 | 10 | 25 |
| 83-90 | 4 | 29 |
| 91-98 | 2 | 31 |
The first column of the table shows the test score ranges; the second column shows the number of students who attained a score in that range; the third column is a sum of the number of students in that specific class interval and all previous class intervals. Referencing the 59-66 class interval, 5 students attained scores in that range, and a total of 8 students attained scores in all the class intervals up to and including the 59-66 class interval. Based on this data, certain conclusions can be made, such as the fact that only 8 students received a score below 67 on the test.
Cumulative frequency can also be demonstrated using a graph. In a cumulative frequency graph, the cumulative frequency is the dependent variable (y-axis), and the other variable is the independent variable (x-axis). The graph below shows both the frequency distribution and the cumulative frequency distribution of the number of grams of protein in various foods.
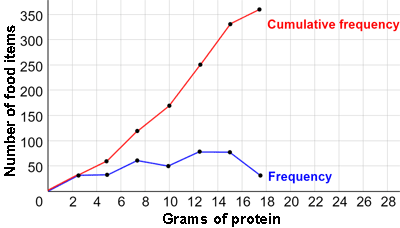
The frequency graph shows the number of grams of protein in a given number of food items. For example, the point (10, 50) on the frequency graph indicates that there are 50 food items containing 10 grams of protein.
The cumulative frequency graph shows the total number of food items containing the number of grams of protein (or less) at a given point. For example, the point (10, 170) indicates that 170 of the food items contain 10 grams of protein or less.