Standard deviation
Standard deviation is a statistical measure of variability that indicates the average amount that a set of numbers deviates from their mean. The higher the standard deviation, the more spread out the values, while a lower standard deviation indicates that the values tend to be close to the mean.
Standard deviation is used throughout statistics, and in many cases is a preferable measure of variability over variance because it is expressed in the same units as the collected data while the variance (the square of the standard deviation) has squared units.
In science, standard deviation is commonly reported alongside the standard error of the estimate. Together, they are used to determine whether the effects or results of an experiment are statistically significant. 95% of values in a normal distribution typically fall within the first two standard deviations from the mean, or expectation, so only the remaining 5%, those that vary by more than two standard deviations, are typically considered statistically significant.
Standard deviation formulas
Like variance and many other statistical measures, standard deviation calculations vary depending on whether the collected data represents a population or a sample. A sample is a subset of a population that is used to make generalizations or inferences about a population as a whole using statistical measures. Below are the formulas for standard deviation for both a population and a sample. In most experiments, the standard deviation for a sample is more likely to be used since it is often impractical, or even impossible, to collect data from an entire population.
For a population:

where N is the population size, μ is the population mean, and xi is the ith element in the set.
For a sample:

where n is the sample size, is the sample mean, and xi is the ith element in the set.
Note that both the formulas for standard deviation contain what is referred to as the sum of squares (SS), which is the sum of the squared deviation scores. The calculation of SS is necessary in order to determine variance, which in turn is necessary for calculating standard deviation. SS is worth noting because in addition to variance and standard deviation, it is also a component of a number of other statistical measures.
In the standard deviation formula for a population,  . Similarly, in the standard deviation formula for a sample,
  . The only term that changes is the mean (sample or population) used in the formula.
Example
Determine the standard deviation of the following height measurements assuming that the data was obtained from a sample of the population.
| Height (cm) |
|---|
| 154 |
| 161 |
| 172 |
| 173 |
| 181 |
1. Find the sample mean:

2. Find the sum of squares (SS):
| SS = |  |
| = | (154 - 168.2)2 + (161 - 168.2)2 + (172 - 168.2)2 + (173 - 168.2)2 + (181 - 168.2)2 |
| = | 454.8 |
3. Compute the sample standard deviation:

Thus the standard deviation of the sampled height measurements is 10.663. As a general rule of thumb, s should be less than half the size of the range, and in most cases will be even smaller. This can be used as a cursory check for sizable computation errors. The range of the above scores is:
181 - 154 = 27
10.663 lies well within what we might expect, so while there may be other potential sources of error, the result is reasonable enough that we do not expect error due to our calculations.
Calculations for the standard deviation of a population are very similar to those for a sample, with the key differences being the use of the population rather than the sample mean, and the use of N rather than n - 1.
The empirical rule
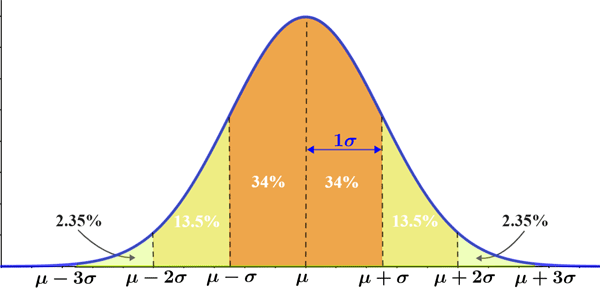
The empirical rule (also referred to as the 68-95-99.7 rule) states that for data that follows a normal distribution, almost all observed data will fall within 3 standard deviations of the mean. More specifically, where μ is the mean and σ is the standard deviation:
- Approximately 68% of observed data falls within 1 standard deviation of the mean (denoted μ ± σ).
- Approximately 95% of observed data falls within 2 standard deviations of the mean (denoted μ ± 2σ).
- Approximately 99.7% of observed data falls within 3 standard deviations of the mean (denoted μ ± 3σ).
The empirical rule is represented in the figure below:
The empirical rule is useful for providing a rough estimate of the outcome of an experiment as long as the data follows a normal distribution. It can also be used to determine if a given set of data follows a normal distribution. For example, if it takes an average of 20 minutes in line to be admitted to the venue of a concert, the admission time has a standard deviation of 3.5 minutes, and the data follows a normal distribution, the empirical rule can be used to forecast that given a sample of the people who attended the concert:
- 68% of the admission times would fall within the range of 16.5-23.5 minutes.
- 95% of the admission times would fall within the range of 13-27 minutes.
- 99.7% of the admission times would fall within the range of 9.5 - 30.5 minutes.
Did you know??
There are other formulas for calculating standard deviation depending on how the data is distributed. For example, the standard deviation for a binomial distribution can be computed using the formula

where p is the probability of success, q = 1 - p, and n is the number of elements in the sample.
Example
An NBA player makes 80% of his free throws (so he misses 20% of them). Find the standard deviation given that he shoots 10 free throws in a game.
The probability of success of each shot is p = 0.8, so q = 1 - 0.8 = 0.2. He shoots 10 free throws in the game, so n = 10, and the standard deviation is computed as:
