Stem and leaf plot
A stem-and-leaf plot is a type of graph that organizes data so that frequencies can be compared.
Example
The stem-and-leaf plot groups the football scores shown in the table. The first column represents tens and the second column represents ones:
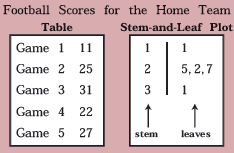
| 1 | 1 | means 11. |
| 2| 5, 2, 7 | means 25, 22, and 27. |
| 3 | 1 | means 31. |
The plot shows that scores for most of the games were in the 20s.