Interquartile range
In statistics, the interquartile range (IQR) is a measure of how spread out the data is. It is equal to the difference between the 75th and 25th percentiles, referred to as the third (Q3) and first quartiles (Q1), respectively. Thus, the IQR is comprised of the middle 50% of the data, and is therefore also referred to as the midspread, or middle 50%.
The IQR is particularly useful when data is contaminated (e.g. has many outliers) because it excludes extreme values. It can also be used to find outliers in a set of data.
How to find the IQR
Given a set of data ordered from smallest to largest,
{3, 4, 7, 11, 12, 16, 21, 22, 30, 32, 105}
the IQR can be found by subtracting Q1 from Q3, or:
IQR = Q3 - Q1
Refer to the quartile page for more information on how to find each quartile. Q2 is the median of the set of data, Q1 is the median of the data between the first element and Q2, and Q3 is the median of the data between Q3 and the final element of the set.
Thus, in the set above, Q1 is 7, Q2 is 16, and Q3 is 30. The interquartile range is therefore:
IQR = 30 - 7 = 23
Example
Find the IQR for the set:
{1, 4, 6, 9, 15, 21, 22, 27, 35, 40, 41, 56}
The following formulas can be used to determine the position of the quartiles in the set
Q1 = 0.25(n + 1)
Q3 = 0.75(n + 1)
where n is the number of terms in the set. Thus:
Q1 = 0.25(12 + 1) = 3.25
Q3 = 0.75(12 + 1) = 9.75
The decimal values indicate that the quartile lies between the elements closest to the value. Thus, Q1 lies between the 3rd and 4th element in the set, and Q3 lies between the 9th and 10th elements. Averaging the terms in those positions yields Q1 and Q3:


Thus, the interquartile range can be calculated as:
IQR = 37.5 - 7.5 = 30
Using the IQR to find outliers
The IQR can be used to find outliers (values in the set that lie significantly outside the expected value). Values that lie farther than 1.5 times the IQR away from either end of the IQR (Q1 or Q3) are considered outliers, as shown in the figure below:
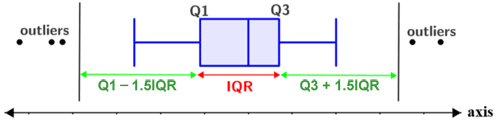
Thus, the expected range of values is:
[Q1 - 1.5(IQR), Q3 + 1.5(IQR)]
Anything outside the above range of values is an outlier.
Example
Find any outliers for the following set of data:
{1, 3, 4, 6, 13, 20, 25, 26, 28, 62, 95}
Q2 is the median, and since there are 11 elements in the set, Q2 is the middle value. Q1 is the median of the first 25% of values (first element through Q1) and Q3 is the median of the last 25% of values (Q3 through the final element). Q1 is highlighted in green, Q2 in red, and Q3 in blue:
{1, 3, 4, 6, 13, 20, 25, 26, 28, 62, 95}
IQR is the difference between Q3 and Q1:
IQR = 28 - 4 = 24
Thus any value outside of the range
[4 - 1.5(24), 28 + 1.5(24)] = [-32, 64]
is an outlier. All of the data, except for 95, lies within the above range. Thus, 95 is the only outlier in the set.