Quartile
In statistics, a quartile is an element in a data set, ordered from smallest to largest, that divides the set into four parts, or quarters. The four parts are more or less equal in size, but can vary slightly depending on the number of elements in the set. In the set below, 9, 28, and 47 are quartiles:
{3, 5, 9, 10, 21, 28, 32, 38, 47, 58, 66}
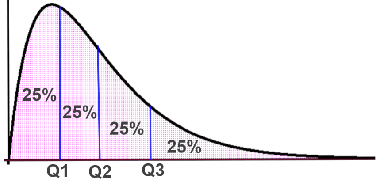
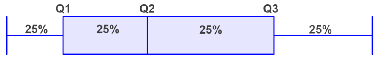
In the above set, the quartiles divide the set into four equal parts, so each of the four parts contains 25% of the data. In cases where the data cannot be exactly divided into four equal parts, some parts will have more elements than others, but each part will still roughly comprise 25% of the data. The second quartile, referred to as Q2, is the median of the set. In this case Q2, or 28, is the median.
There are a number of different ways to refer to each of the quartiles, such as Q1, Q2, and Q3:
- Q1 - also referred to as the first quartile, lower quartile, or 25th percentile. Q1 separates the lowest 25% of data from the highest 75%.
- Q2 - also referred to as the second quartile, middle quartile, median, or 50th percentile. Q2 separates the lowest 50% of data from the highest 50%. In other words, it cuts the data in half.
- Q3 - also referred to as the third quartile, upper quartile, or 75th percentile. Q3 separates the highest 25% of data from the lowest 75%.
Quartiles can be depicted using a number of different graphical methods, such as a frequency distribution or a box plot.
Frequency distribution
Box plot
How to select quartile values
There is no one way to select quartile values that everyone agrees on, but there are some general guidelines for doing so. Before starting the process, the set of data must be arranged from smallest to largest:
{1, 4, 5, 6, 7, 10, 11, 13, 16, 18, 25}
- Use the median to divide the set into two halves. If there are an odd number of elements in the set, the middle value, or Q2, divides the set in half. If there are an even number of elements, take the average of the two elements closest to the middle. Q2 divides the set in half at this average value. In the example above, Q2 = 10.
- The lower quartile, Q1, is the median of the lower half of the data (from the first element to Q2).
- The upper quartile, Q3, is the median of the upper half of the data (from Q2 to the final element).
The following formulas can be used to determine the position of each quartile. They are particularly useful when working with larger data sets. Given that the set is ordered from smallest to largest,
Q1 = 0.25(n + 1)
Q2 = 0.50(n + 1)
Q2 = 0.75(n + 1)
where n is the number of elements in the set. Note that the formulas output the position of the quartile, not the actual value of the element. For example, using the data set above:
Q1 = 0.25(11 + 1) = 3
Thus, Q1 is the 3rd element (5) in the set. If there are an even number of elements in the set, the formulas yield a decimal number, which indicates that the quartile lies between the values of the two elements on either side of the element denoted by the decimal number. For example, if Q1 = 2.3, Q1 is determined by computing the average of elements 2 and 3 in the set. Using the above set, Q1 would be (4 + 5)/2 = 4.5.
Using quartiles to find the interquartile range
The interquartile range (IQR) is comprised of the range of values between the first and third quartiles, and is a measure of how spread out the middle 50% of the data is. 50% of the data is contained within this range:
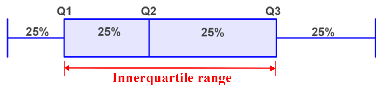
The interquartile range is found by subtracting Q1 from Q3:
IQR = Q3 - Q1
Using quartiles to find outliers
Quartiles can be used to find outliers (values in the set that lie significantly outside the expected value). Values that lie farther than 1.5 times the IQR away from either end of the IQR (Q1 or Q3) are considered outliers, as shown in the figure below:
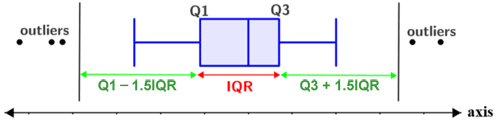
Thus, the expected range of values is:
[Q1 - 1.5(IQR), Q3 + 1.5(IQR)]
Anything outside the above range of values is an outlier.