X and y axis
The x-axis and y-axis are axes in the Cartesian coordinate system. Together, they form a coordinate plane, which is the space in which two-dimensional graphing occurs.
In two-dimensional space, the x-axis is the horizontal axis, while the y-axis is the vertical axis. They are represented by two number lines that intersect perpendicularly at the origin, located at (0, 0), as shown in the figure below.
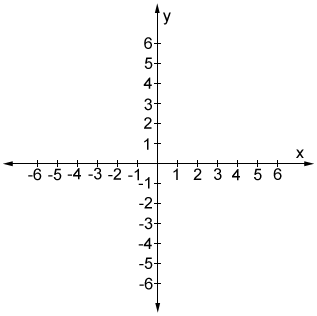
The above representation of the coordinate plane is one of the most basic forms, where each tick mark on the axis represents 1 unit. It is worth noting that the axes can be labeled in any number of ways, as long as each axis maintains a consistent interval. For example, instead of the x-axis counting up by 1, the first tick mark to the right of 0 could be labeled 2, the subsequent one 4, and the next 6. In this case, the space between each tick mark represents 2 units. The y-axis in this same example could even have tick marks that represent 3 units; the x-axis and the y-axis do not have to have the same interval between marks. It is therefore important to pay attention to the axis markings, since differences in selected axes intervals can significantly impact the shape of a given graph.
Ordered pairs
A given point in the coordinate plane is designated using what is referred to as an ordered pair. An ordered pair is a pair of values in which the first value indicates the x-coordinate and the second indicates the y-coordinate. An ordered pair is written as follows:
(x, y)
where x is the x-value and y is the y-value. In an ordered pair, the x and y-values are enclosed within parenthesis and separated by a comma. Note that the reason it is called an ordered pair is because the x-value must come first, followed by the y-value. In other words, (x, y) is not the same as (y, x). Consider points A, B, and C graphed in the coordinate plane below.
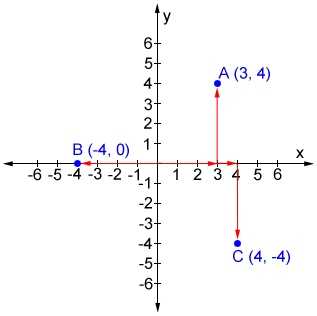
The red arrows indicate how we move from the origin to a given point in the coordinate plane, as described below.
- For point A, move to the right 3 units on the x-axis to get an x-coordinate of 3, then move up 4 units on the y-axis to get a y-coordinate of 4.
- For point B, move to the left 4 units on the x-axis to get an x-coordinate of -4. Since there is no vertical distance to move on the y-axis the y-coordinate is 0.
- For point C, move to the right 4 units on the x-axis to get an x-coordinate of 4, then move down 4 units on the y-axis to get a y-coordinate of -4.
Thus, to plot a point on a coordinate plane, we simply need to know the ordered pair. Then, we can plot the point by counting the appropriate number of units along the x- and y-axes. Once we can plot points in the coordinate plane, we can move on to graphing more complicated objects, since a graph of a line or some other function is simply a visual representation of all the points, or ordered pairs, that make up the function.
x- and y-intercepts
The x-intercept is a point at which a graph intercepts the x-axis. Likewise, the y-intercept is a point at which a graph intercepts the y-axis. The y-coordinate of an x-intercept is always 0, and the x-coordinate of a y-intercept is always 0.
Given an equation, plugging in x = 0 and solving for y will yield the y-intercept and plugging in y = 0 and solving for x will yield the x-intercept.
Example:
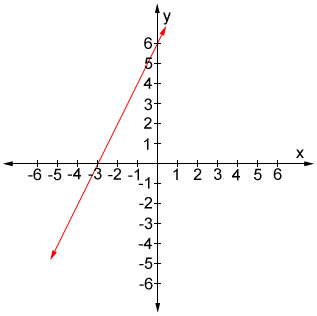
Find the coordinates of the x- and y-intercepts of the graph of y = 2x + 6.
Plug y = 0 into y = 2x + 6:
0 = 2x + 6
-6 = 2x
x = -3
The x-intercept is located at (-3, 0).
Plug x = 0 into the equation:
y = 2 × 0 + 6
y = 6
The y-intercept is located at (0, 6).