Continuous random variable
A random variable is a variable that has a numerical value that is dependent on the outcome of a random event. A continuous random variable is a random variable that has an infinite number of possible outcomes (usually within a finite range). The following variables are examples of continuous random variables:
- X = the time it takes for a person to run a 40-yard dash
- Y = the height of a tree
- Z = the volume of water flowing over a waterfall
For real life situations, such as those described above, the range of values that a continuous random variable can take on is typically not infinite. For example, there is some lower and upper limit for how fast a person can run a 40-yard dash. However, within this lower and upper limit (such as 4-6 seconds), a continuous random variable can take on an infinite number of values. This is true for all continuous random variables.
Probability distribution of a continuous random variable
The probability distribution of a continuous random variable cannot be determined in the same way as the probability distribution of a discrete random variable. For a discrete random variable, the probability of any single outcome occurring can be determined exactly using a probability mass function. In the case of continuous random variables, the probability of any single outcome occurring is 0. It is only possible to determine the probability that any outcome within a given interval will occur. This can be done using a probability density function (pdf).
Probability density function
The figure below shows the pdf for a continuous random variable:
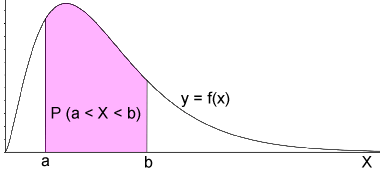
The probability that an outcome, X, lies between the interval a and b is represented by the shaded area under the curve, which can be found by computing the integral of the pdf over the given interval. In other words,

Note that if a were -∞ and b were +∞,

This is because the probability over the entire pdf must be equal to 1, since there is a 100% chance that X would lie in this interval if it is a real number.
Example
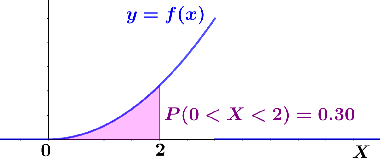
Let f be the pdf for a continuous random variable, X, such that

Find P(0 < X < 2).
 |
 |
 |
Thus, the probability that X lies between 0 and 2 is approximately 30%, as depicted in the figure below.
Expected value and variance of a continuous random variable
It is possible to find the expected value (or mean) and variance of a continuous random variable using its pdf.
The expected value, E(X), of a continuous random variable with a pdf, f(x), is:

The variance, Var(X), is

where

Example
Find the expected value and variance for the continuous random variable, X, given the following pdf:
First, calculate the expected value:
 |
 |
 |
|
 |
Next, calculate E(X2):
 |
 |
 |
|
 |
Finally, calculate the variance:
