Poisson distribution
A Poisson distribution is a discrete probability distribution that describes the probability that an independent event occurs a certain number of times over a fixed interval of time, distance, area, or volume, etc.
For example, a specific red light may be run an average of 2,000 times per month. Each event is independent because a person running a red light does not have an effect on when the next person will run a red light. In peak hours, more red lights will be run within a given span of time than during non-peak hours. The number of times the red light is run during any minute has a Poisson distribution.
The Poisson distribution has the following probability mass function (pmf)

where λ is the expected value of the random variable, X, and e ≈ 2.718 is Euler's number. The pmf of a Poisson distribution can only be used to determine the probabilities associated with a random variable under the following conditions:
- The random variable, X, is a discrete random variable, as opposed to a continuous random variable.
- The expected value is equal to the variance, or λ = σ2, λ > 0.
- The events are independent of each other; one event occurring does not affect the probability of another occurring.
- The events are mutually exclusive; they cannot occur simultaneously.
- The average rate at which events occur is assumed to be constant; the rate is independent of any individual occurrence.
If the above are true, then X is a Poisson random variable and exhibits a Poisson distribution. The associated probabilities can then be found by evaluating the pmf of a Poisson distribution over the desired interval, or by using cumulative Poisson distribution tables.
Example
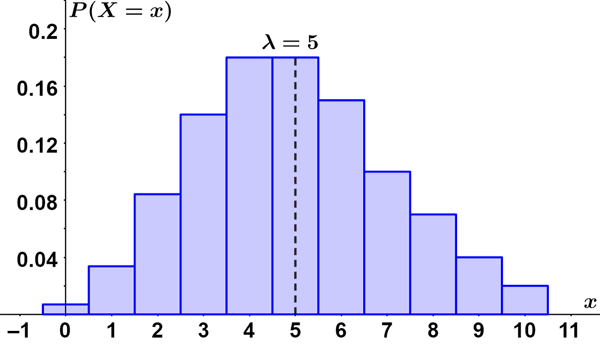
A given traffic light is run an average of 5 times per month.
- Find the probability that the light is run 8 times on any given month.
- Find the probability that the light is run at least 3 times on any given month.
i. λ = 5 and x = 8, so:

Thus, there is approximately a 6.5% chance that the light will be run 8 times in any given month.
ii. The probability that the light will be run at least 3 times can be determined as 1 - P(X ≤ 2):
 |
 |
 |
|
 |
|
 |
Thus, there is around an 88% chance that the light will be run at least 3 times on any given month. The figure below shows the Poisson distribution for λ = 5.
Cumulative Poisson distribution tables
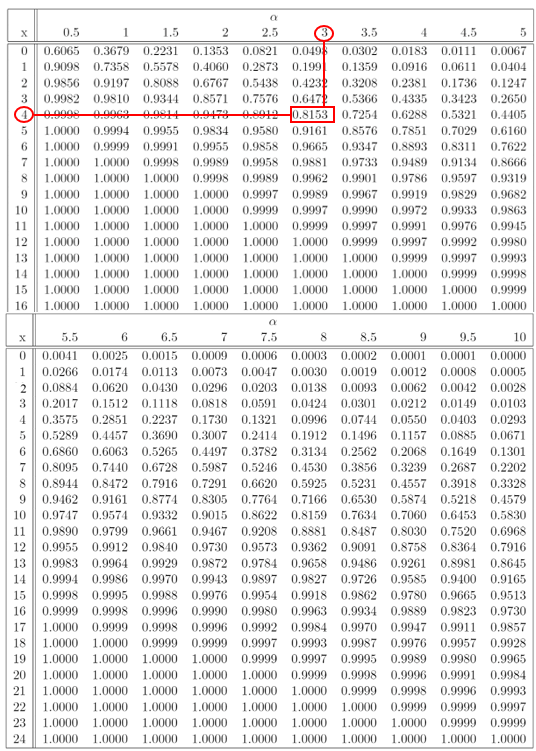
Like other probability distributions (such as the standard normal distribution), tables for Poisson distributions have been constructed for convenience. For given values of x and λ, P(X ≤ x) is the value in row x and column λ. For example, given λ = 3, P(X ≤ 4) can be determined as shown in the figure below:
Example
Referencing the above example, use the cumulative Poisson distribution table instead of the pmf to find P(X = 8) and P(X≥3).
i. To find P(X = 8), we need to subtract P(X ≤ 7) from P(X ≤ 8), both of which are values we can read off of the cumulative Poisson distribution table.

ii. To find P(X ≥ 3), we need to subtract P(X ≤ 2) from 1.
|
|
 |
Regardless of the method used, the result is identical.