Standard normal distribution
A standard normal distribution, also referred to as a Z distribution, is a special case of the normal distribution. Rather than the mean and standard deviation of a normal distribution being any real number, a standard normal distribution has a mean (μ) of 0 and a standard deviation (σ) of 1.
Standardizing normal distributions makes it possible to easily compare different normal distributions. It also makes it possible to use Z tables to determine probabilities that would otherwise be difficult to compute through integration of the probability density function (pdf) of a normal distribution. The general form of the pdf of a normal distribution is

where μ is the mean, and σ is the standard deviation.
Substituting μ = 0 and σ = 1 yields the pdf of a standard normal distribution:

Probability density functions are used to determine the probability that a random variable will lie within a certain range of values. This is typically done by integrating the pdf over the interval of interest. However, even the simplified pdf of the standard normal distribution is complicated to integrate and is usually done using computers or calculators. Fortunately, random variables that exhibit normal distributions are so widespread that mathematical tables, referred to as Z tables, exist for standard normal distributions (hence the alternate name Z distribution).
Since all normal distributions can be converted to Z distributions, Z tables can be used to find the probability of values in a normal distribution lying above, below, or between values on a Z distribution. Furthermore, different normal distributions can be directly compared without the need to interpret differences in the distributions that result from varying means and standard deviations.
Converting normal distributions to Z distributions
The data points in a normal distribution are the outcomes of the random variable, X, while the data points of a Z distribution are Z scores, also referred to as standard scores. Z scores are the standardized values of the outcomes from a normal distribution, and are computed for a given x value using the following formula:

where μ is the mean and σ is the standard deviation. The Z score of a value indicates the position of a score in terms of distance from the mean, measured in standard deviations. For example, a Z score of 1 indicates that the score is 1 standard deviation from the mean. Z scores can be positive, negative, or 0:
- A positive Z score indicates that a value is above (right of) the mean.
- A negative Z score indicates that a value is below (left of) the mean.
- A Z score of 0 indicates that a value is equal to the mean.
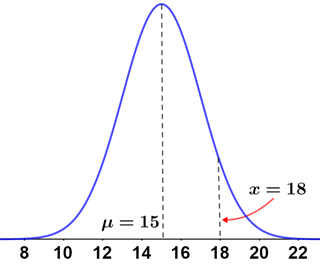
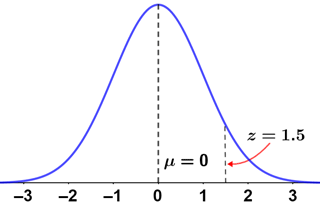
The first figure depicts a normal distribution with μ = 15, σ = 2, and x = 18; the second is its corresponding Z distribution. The x value (and all values in the normal distribution) is standardized as follows:

| Normal distribution | Z distribution |
|---|---|
|
|
Once the Z score of an observed value has been calculated, it is possible to use a Z table to determine various probabilities surrounding the value.
Z tables
Z tables are tables that indicate the probability that the values in a normal distribution lie below, above, or between values on a standard normal distribution. They are useful because many quantities, such as height, weight, test scores, and more, have normal distributions. Typically, it is necessary to integrate the probability density function of a continuous random variable to determine the probabilities of various outcomes. However, since normal distributions are so widespread, and all normal distributions can be converted to a standard normal distribution, tables of these probabilities are widely available for standard normal distributions.
There are a few different types of Z tables, but essentially, once the Z score of a value is calculated, the score can be referenced in a Z table to determine various probabilities.
Example
The average full-term pregnancy for a certain breed of rabbits averages 30 days, with a standard deviation of 3 days. What is the probability that a rabbit chosen has a pregnancy that lasts for more than 34 days?
Let X represent the random variable that is the number of days that pregnancy lasts for this breed of rabbits. The probability that a pregnancy lasts longer than 34 days can be written as P(X > 34). Assuming that X is normally distributed, the Z score for this outcome can be computed as:

Looking this Z score up in a cumulative from mean Z table, there is approximately a 41% chance that a rabbit will have a pregnancy that lasts between 30 and 34 days. To determine P(X > 34), this probability needs to be subtracted from 0.50, since 50% of the values in a normal distribution lie above the mean (z = 0), as depicted in the figure below.
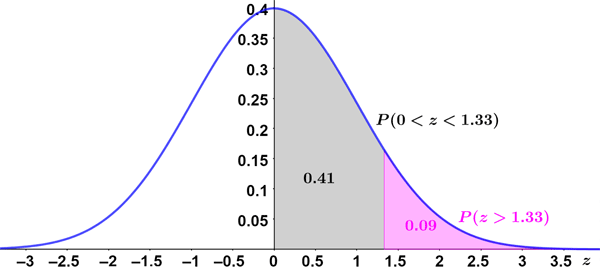
Thus:
| P(Z > 1.33) | = 0.5 - P(0 < Z < 1.33) |
| = 0.5 - 0.41 = 0.09 |
Therefore, there is a 9% chance that a randomly chosen rabbit from this breed will have a pregnancy that lasts longer than 34 days.
Interpolating a Z table
Most Z tables only provide probabilities for Z scores that are rounded to the nearest hundredth. For more precision, linear interpolation can be used. Linear interpolation is an approximation technique that can be used to approximate values between two known points using the slope of the line between those two points. In the case of Z scores, the Z score is the x value, and the associated probability is the y value.
For example, to determine the probability P(0 < Z < 1.245), use the closest Z scores, 1.24 and 1.25, which have the following probabilities:
| Z score | Probability |
|---|---|
| 1.24 | 0.39251 |
| 1.245 | y |
| 1.25 | 0.39435 |
Given a linear relationship, we can solve for y by setting up two slope equations, since the slope between any two points on a line must be equal, as depicted in the figure below.
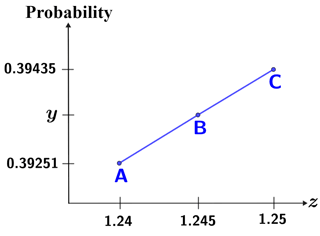
Thus, to solve for y, equate two slope equations as follows:
 |
 |
 |
 |
 |
 |
 |
 |
Therefore, P(0 < Z < 1.245) = 0.3943, or approximately 40%.